Pepsi 2014 Annual Report Download
Download and view the complete annual report
Please find the complete 2014 Pepsi annual report below. You can navigate through the pages in the report by either clicking on the pages listed below, or by using the keyword search tool below to find specific information within the annual report.-
 1
1 -
 2
2 -
 3
3 -
 4
4 -
 5
5 -
 6
6 -
 7
7 -
 8
8 -
 9
9 -
 10
10 -
 11
11 -
 12
12 -
13
-
14
-
15
-
16
-
17
-
18
-
19
-
20
-
21
-
22
-
23
-
24
-
25
-
26
-
27
-
28
-
29
-
30
-
31
-
32
-
33
-
34
-
35
-
36
-
37
-
38
-
39
-
40
-
41
-
42
-
43
-
44
-
45
-
46
-
47
-
48
-
49
-
50
-
51
-
52
-
53
-
54
-
55
-
56
-
57
-
58
-
59
-
60
-
61
-
62
-
63
-
64
-
65
-
66
-
67
-
68
-
69
-
70
-
71
-
72
-
73
-
74
-
75
-
76
-
77
-
78
-
79
-
80
-
81
-
82
-
83
-
84
-
85
-
86
-
87
-
88
-
89
-
90
-
91
-
92
-
93
-
94
-
95
-
96
-
97
-
98
-
99
-
100
-
101
-
102
-
103
-
104
-
105
-
106
-
107
-
108
-
109
-
110
-
111
-
112
-
113
-
114
-
115
-
116
-
117
-
118
-
119
-
120
-
121
-
122
-
123
-
124
-
125
-
126
-
127
-
128
-
129
-
130
-
131
-
132
-
133
-
134
-
135
-
136
-
137
-
138
-
139
-
140
-
141
-
142
-
143
-
144
-
145
-
146
-
147
-
148
-
149
-
150
-
151
-
152
-
153
-
154
-
155
-
156
-
157
-
158
-
159
-
160
-
161
-
162
-
163
-
164
-
165
-
166
 |
 |
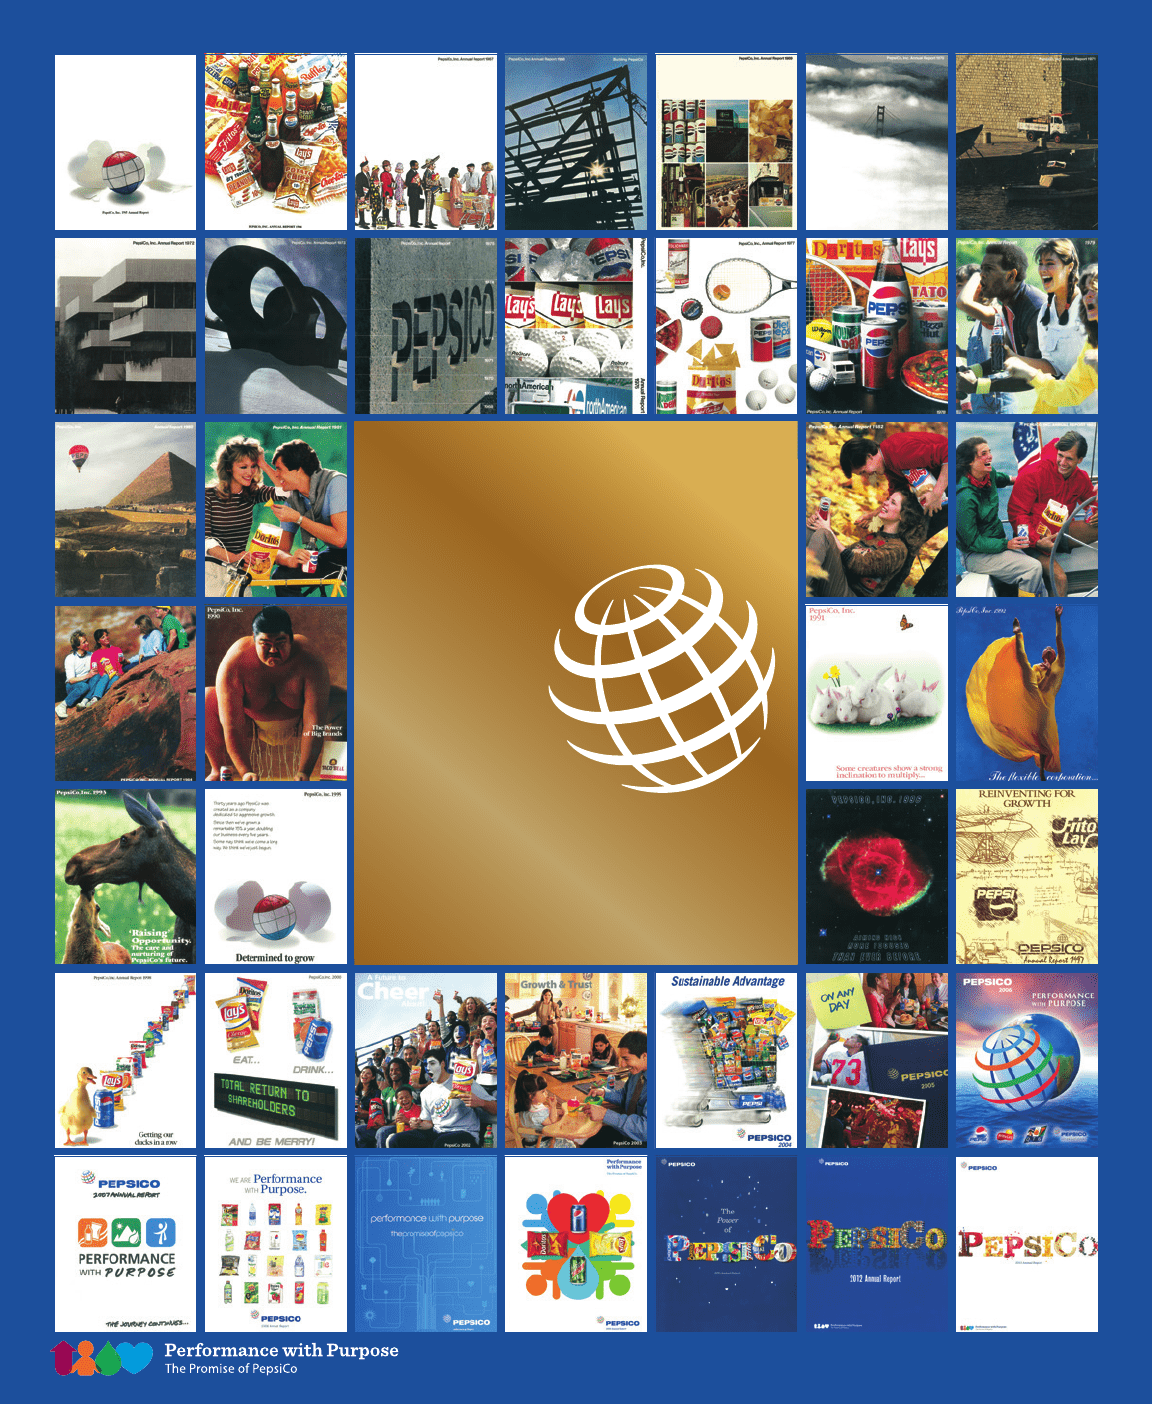
YEARS & GROWING
PepsiCo 2014 Annual Report
PEPSICO
5
Table of contents
-
Page 1
5 PEPSICO YEARS & GROWING PepsiCo 2014 Annual Report -
Page 2
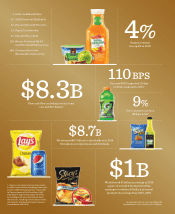
1 Letter to Shareholders 12 2014 Financial Highlights 13 PepsiCo Board of Directors 14 PepsiCo Leadership 15 PepsiCo Form 10-K 141 Reconciliation of GAAP and Non-GAAP Information 144 Common Stock and Shareholder Information 4% Organic revenue was up 4% in 20141 $8.3B Free cash flow, excluding ... -
Page 3
2014 ANNUAL REPORT 1 Dear Fellow Shareholders, Indra K. Nooyi PepsiCo Chairman of the Board and Chief Executive Officer PepsiCo delivered another year of strong performance in 2014, resulting in double-digit total shareholder returns. As 2015 heralds our company's 50th anniversary, I want to ... -
Page 4
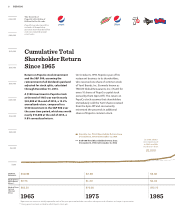
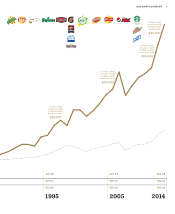
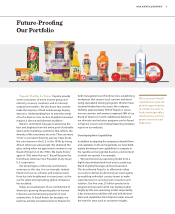
...The Growth of PepsiCo's Portfolio of Billion Dollar Brands BRAND $40,000 PepsiCo's product portfolio includes 22 brands that generate more than $1 billion each in estimated annual retail sales. $35,000 $30,000 Cumulative Total Shareholder Return Since 1965 Return on PepsiCo stock investment and... -
Page 5
... ANNUAL REPORT 3 In 2014, a $100 investment made in 1965 would be worth nearly: $43,000 In 2013, a $100 investment made in 1965 would be worth more than: $30,000 In 2005, a $100 investment made in 1965 would be worth more than: $20,000 In 1997, a $100 investment made in 1965 would be worth... -
Page 6
... our direct store delivery (DSD) selling system to provide excellent service to large and small retailers alike. Thanks in large part to our company's focus on the transforming retail environment, in 2014 PepsiCo was the number one food and beverage business in the U.S., Canada, Russia, India... -
Page 7
... of our Board of Directors in 2014. (Additional details on our diversity and inclusion programs can be found in PepsiCo's most recent Global Reporting Initiative report on our website.) Developing New Capabilities In addition to adapting the company to benefit from and capitalize on these megatrends... -
Page 8
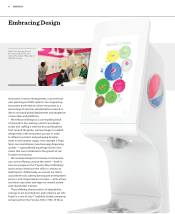
... Center ha s attracted world-class talent. Far right: A Pepsi Spire digital fountain. innovation, revenue management, customer business planning and DSD systems. Our stepped-up innovation performance, where innovation as a percentage of sales has substantially increased, is due to our rapid global... -
Page 9
...net return on invested capital (ROIC) improved 110 basis points, to 17.5%. • Core constant currency earnings per share (EPS) grew 9%. • Free cash flow excluding certain items was strong at $8.3 billion. • PepsiCo increased its annual dividend for the 42nd consecutive year in 2014 and returned... -
Page 10
... Bowl" received nearly 5,000 consumer submissions from 29 countries around the world. In fact, we had 10 of the top 50 new food and beverage product launches in North America in 2014.7 Second, we continued to benefit from our aggressive productivity culture and mindset. We delivered $1 billion of... -
Page 11
... engagement and build brand equity. We are also partnering with our retail customers on programs linking to their social media platforms, allowing us to reach the right consumers at the right time with the right offerings. Second, our increased investment in digital is creating unique opportunities... -
Page 12
... for Best Shareholder Engagement. • PepsiCo won Best Governance, Risk and Compliance Program at a Large-Cap Company at the New York Stock Exchange Governance Services' inaugural Governance, Risk & Compliance Leadership Awards. • PepsiCo was named to the Dow Jones Sustainability North America... -
Page 13
... around the world. They have been steadfast in their commitment to our business, and the success PepsiCo has achieved over the past half-century is thanks to their determination, sacrifice and deep love for our company. All of us at PepsiCo owe a great debt to the four Chief Executive Officers who... -
Page 14
... Americas Beverages 26% PepsiCo Europe 12% Latin America Foods 11% PepsiCo AMEA 9% Quaker Foods North America 6% PepsiCo, Inc. and Subsidiaries (in millions except per share data; all per share amounts assume dilution) Summary of Operations Net revenue Core total operating profit (b) (c) 2014... -
Page 15
... Partner, Advent International; Former Chairman, Chief Executive Officer and President, H.J. Heinz Company 66. Elected 2015. Not pictured (retiring from the Board as of PepsiCo's 2015 Annual Meeting of Shareholders): Ray L. Hunt Chairman of the Board and Chief Executive Officer, Hunt Consolidated... -
Page 16
... Chief Scientific Officer, Global Research and Development Cynthia M. Trudell Executive Vice President, Human Resources and Chief Human Resources Officer, PepsiCo Hugh F. Johnston Executive Vice President and Chief Financial Officer, PepsiCo Albert P. Carey Chief Executive Officer, PepsiCo Americas... -
Page 17
PepsiCo, Inc. Annual Report 2014 Form 10-K For the ï¬scal year ended December 27, 2014 -
Page 18
page intentionally left blank -
Page 19
... Jurisdiction of Incorporation or Organization) 700 Anderson Hill Road, Purchase, New York (Address of Principal Executive Offices) 13-1584302 (I.R.S. Employer Identification No.) 10577 (Zip Code) PepsiCo, Inc. Registrant's telephone number, including area code: 914-253-2000 Securities registered... -
Page 20
... sale price of PepsiCo, Inc.'s Common Stock on that date as reported on the New York Stock Exchange). The number of shares of PepsiCo, Inc. Common Stock outstanding as of February 6, 2015 was 1,482,368,514. Documents Incorporated by Reference Portions of the Proxy Statement relating to PepsiCo... -
Page 21
...Matters and Issuer Purchases of Equity Securities Item 6. Selected Financial Data Item 7. Management's Discussion and Analysis of Financial Condition and Results of Operations Item 7A. Quantitative and Qualitative Disclosures About Market Risk Item 8. Financial Statements and Supplementary Data Item... -
Page 22
..., Pepsi-Cola, Quaker and Tropicana. Through our operations, authorized bottlers, contract manufacturers and other third parties, we make, market, distribute and sell a wide variety of convenient and enjoyable beverages, foods and snacks, serving customers and consumers in more than 200 countries and... -
Page 23
... total net revenue in 2014 and 21% of our total net revenue in both 2013 and 2012. Quaker Foods North America Either independently or in conjunction with third parties, QFNA makes, markets, distributes and sells cereals, rice, pasta, dairy and other branded products. QFNA's products include Quaker... -
Page 24
... 20%, 21% and 20% of our total net revenue in 2014, 2013 and 2012, respectively. PepsiCo Asia, Middle East and Africa Either independently or in conjunction with third parties, AMEA makes, markets, distributes and sells a number of leading snack food brands including Lay's, Kurkure, Chipsy, Doritos... -
Page 25
... prices increase, we may or may not pass on such increases to our customers. See Note 10 to our consolidated financial statements for additional information on how we manage our exposure to commodity costs. See also "Item 1A. Risk Factors - Our business, financial condition or results of operations... -
Page 26
... others. See also "Item 1A. Risk Factors - Our intellectual property rights could be infringed or challenged and reduce the value of our products and brands and have an adverse impact on our business, financial condition or results of operations." Seasonality Our businesses are affected by seasonal... -
Page 27
... used in finished goods sold by them to these retailers. See Note 8 to our consolidated financial statements for more information on our customers, including our independent bottlers. Our Competition Our beverage, food and snack products are in highly competitive industries and markets and compete... -
Page 28
... innovation in our packaging to make it increasingly sustainable, and developed and implemented new technologies to enhance the quality and value of our current and future products, as well as made investments to incorporate into our operations best practices and technology to support sustainable... -
Page 29
...our business activities, increase our operating costs, reduce demand for our products or result in litigation." and "Item 1A. Risk Factors - Our business, financial condition or results of operations could be adversely affected if we are unable to grow our business in developing and emerging markets... -
Page 30
..., increase our operating costs, reduce demand for our products or result in litigation." and "Item 1A. Risk Factors - Imposition of new taxes, disagreements with tax authorities or additional tax liabilities could adversely affect our business, financial condition or results of operations." The cost... -
Page 31
... affect our business, financial condition or results of operations. We are a global food and beverage company operating in highly competitive categories and we rely on continued demand for our products. To generate revenues and profits, we must sell products that appeal to our customers and to... -
Page 32
...through use of social media and online advertising campaigns and marketing programs. Although we devote significant resources to the actions mentioned above, there can be no assurance as to our continued ability to develop, launch and maintain successful new products or variants of existing products... -
Page 33
..., may increase our costs or liabilities or reduce demand for our products, which could adversely affect our business, financial condition or results of operations. Governmental entities or agencies in jurisdictions where our products are made, manufactured, distributed or sold may also impose new... -
Page 34
... of new taxes, disagreements with tax authorities or additional tax liabilities could adversely affect our business, financial condition or results of operations. Our products are made, manufactured, distributed or sold in more than 200 countries and territories. As such, we are subject to tax laws... -
Page 35
... business, financial condition or results of operations could suffer if we are unable to compete effectively. Our beverage, food and snack products are in highly competitive industries and markets and compete against products of international beverage, food and snack companies that, like us, operate... -
Page 36
..., political or social conditions, acts of war, terrorist acts, and civil unrest in areas where our products are sold, including Russia, Ukraine, Venezuela and the Middle East; increased competition; a slowdown in growth and the related impact on other countries who export to these markets; our... -
Page 37
... or price risk associated with forecasted purchases of raw materials, or result in a decline in the market value of our investments in debt securities, which could have an adverse impact on our business, financial condition or results of operations. See also "Our business, financial condition or... -
Page 38
... an increase in their costs could adversely affect our business, financial condition or results of operations. Many of our ingredients, raw materials and commodities are purchased in the open market. The prices we pay for such items are subject to fluctuation, and we manage this risk through the use... -
Page 39
... our business, financial condition or results of operations. We are a leading global beverage, food and snack company with brands that are respected household names throughout the world. Maintaining a good reputation globally is critical to selling our branded products. Our reputation or brand image... -
Page 40
... and information technology systems between us and the acquired company and our ability to successfully operate in new categories or territories; motivating, recruiting and retaining executives and key employees; conforming standards, controls (including internal control over financial reporting... -
Page 41
... a divestiture or refranchising is not successfully completed or managed or does not result in the benefits we expect, our business, financial condition or results of operations may be adversely affected. If we are unable to hire or retain key employees or a highly skilled and diverse workforce, it... -
Page 42
...processing, health and benefit plan administration and certain finance and accounting functions. See also "Any damage to our reputation or brand image could adversely affect our business, financial condition or results of operations." and "If we are not able to successfully implement shared services... -
Page 43
...loss of customers or consumers and revenue. Fluctuations in exchange rates may have an adverse impact on our business, financial condition or results of operations. We hold assets and incur liabilities, earn revenues and pay expenses in a variety of currencies other than the U.S. dollar. Because our... -
Page 44
... impair manufacturing and distribution of our products or result in a loss of sales, which could adversely impact our business, financial condition or results of operations. The terms and conditions of existing, renegotiated or new collective bargaining agreements could also increase our costs or... -
Page 45
... our reported financial condition and results; investor perceptions of our performance; actions by shareholders or others seeking to influence our business strategies; speculation by the media or investment community regarding our business; trading activity in our common stock or trading activity... -
Page 46
.... Most international plants are owned or leased on a long-term basis. In addition to company-owned or leased properties described above, we also utilize a highly distributed network of plants, warehouses and distribution centers that are owned or leased by our contract manufacturers, copackers... -
Page 47
... unrest or other developments and risks in the markets where our products are made, manufactured, distributed or sold." and "Item 1A. Risk Factors - Potential liabilities and costs from litigation or legal proceedings could have an adverse impact on our business, financial condition or results of... -
Page 48
...Officer, Global Research and Development Chief Executive Officer, PepsiCo Europe Chief Executive Officer, PepsiCo Latin America Foods Chairman of the Board of Directors and Chief Executive Officer, PepsiCo Executive Vice President, Human Resources and Chief Human Resources Officer, PepsiCo Executive... -
Page 49
... and Chief Financial Officer, PepsiCo in March 2010. In December 2014, Mr. Johnston also assumed responsibility for the Company's global ecommerce business and Quaker Foods North America division. He previously held the position of Executive Vice President, Global Operations since November 2009 and... -
Page 50
... Strategy, Planning and Strategic Marketing for Asea Brown Boveri, Inc. She was also Vice President and Director of Corporate Strategy and Planning at Motorola, Inc. Cynthia M. Trudell, 61, has been Executive Vice President, Human Resources and Chief Human Resources Officer, PepsiCo since April 2011... -
Page 51
... is also listed on the Chicago Stock Exchange and SIX Swiss Exchange. Stock Prices - The composite quarterly high and low closing sales prices for PepsiCo Common Stock as reported on the New York Stock Exchange for each fiscal quarter of 2014 and 2013 are contained in our Selected Financial Data... -
Page 52
... repurchases (in millions, except average price per share) during the fourth quarter of 2014 is set forth in the table below. Issuer Purchases of Common Stock Maximum Number (or Approximate Dollar Value) of Shares that May Yet Be Purchased Under the Plans or Programs (2) $ 5,100 (616) 4,484 (233... -
Page 53
... our convertible preferred share repurchases during the fourth quarter of 2014. Issuer Purchases of Convertible Preferred Stock Total Number of Shares Purchased as Part of Publicly Announced Plans or Programs N/A N/A N/A N/A N/A Maximum Number (or Approximate Dollar Value) of Shares that May Yet... -
Page 54
... and Analysis of Financial Condition and Results of Operations. OUR BUSINESS Executive Overview Our Operations Our Business Risks OUR CRITICAL ACCOUNTING POLICIES Revenue Recognition Goodwill and Other Intangible Assets Income Tax Expense and Accruals Pension and Retiree Medical Plans OUR FINANCIAL... -
Page 55
... Intangible Assets Note 5 - Income Taxes Note 6 - Stock-Based Compensation Note 7 - Pension, Retiree Medical and Savings Plans Note 8 - Related Party Transactions Note 9 - Debt Obligations and Commitments Note 10 - Financial Instruments Note 11 - Net Income Attributable to PepsiCo per Common Share... -
Page 56
..., revenue, organic revenue, operating profit, EPS (as reported and excluding certain items and the impact of foreign exchange translation), retail sales, market share, safety, innovation, product and service quality, organizational health, brand equity, media viewership and engagement, employee... -
Page 57
... businesses. We expect that our increased investments in global research and development will enable us to continue to meet the growing demand for convenient, nutritious products and a broad variety of snack and beverage options. Continue to adapt to changing customer channels. Digital technology... -
Page 58
... year. Our Operations We are organized into six reportable segments (also referred to as divisions), as follows: 1) Frito-Lay North America (FLNA); 2) Quaker Foods North America (QFNA); 3) Latin America Foods (LAF), which includes all of our food and snack businesses in Latin America; 4) PepsiCo... -
Page 59
...the Company's business, including risk assessment and risk mitigation of the Company's top risks. The Board receives updates on key risks throughout the year. In addition, the Board has tasked designated Committees of the Board with certain categories of risk management, and the Committees report to... -
Page 60
... of our products. See "Risk Factors" in Item 1A. for further discussion. Commodity Prices Our open commodity derivative contracts had a notional value of $1.2 billion as of December 27, 2014 and $1.4 billion as of December 28, 2013. At the end of 2014, the potential change in fair value of commodity... -
Page 61
... the SICAD 2 rate was 50 bolivars per U.S. dollar. On February 11, 2015, the Venezuelan government announced that the transactions for the sale or purchase of foreign currency under the SICAD 2 exchange system would no longer be available and created a new open market foreign exchange system (SIMADI... -
Page 62
... 2013 were $9.3 billion and $7.9 billion, respectively. Assuming year-end 2014 investment levels and variable rate debt, a 1-percentage-point increase in interest rates would have decreased net interest expense by $17 million in 2014 due to higher cash and cash equivalents and short-term investments... -
Page 63
... of revenue and totaled $35.8 billion in 2014 and $34.7 billion in both 2013 and 2012. Sales incentives and discounts include payments to customers for performing merchandising activities on our behalf, such as payments for in-store displays, payments to gain distribution of new products, payments... -
Page 64
... and other factors to estimate future levels of sales, operating profit or cash flows. All assumptions used in our impairment evaluations for nonamortizable intangible assets, such as forecasted growth rates and weighted average cost of capital, are based on the best available market information and... -
Page 65
... of PAB's CSD business do not achieve our expected estimated future cash flows or if macroeconomic conditions result in a future increase in the weighted-average cost of capital used to estimate fair value. We have also analyzed the impact of the recent economic and political developments in Russia... -
Page 66
...value of benefits earned by employees for working during the year (service cost), (2) the increase in the liability due to the passage of time (interest cost), and (3) other gains and losses as discussed in Note 7 to our consolidated financial statements, reduced by (4) the expected return on assets... -
Page 67
... at December 27, 2014. See Note 7 to our consolidated financial statements for information about the expected return on plan assets and our plan investment strategy. The health care trend rate used to determine our retiree medical plan's liability and expense is reviewed annually. Our review is... -
Page 68
... these benefits. Our pension and retiree medical contributions are subject to change as a result of many factors, such as changes in interest rates, deviations between actual and expected asset returns and changes in tax or other benefit laws. See Note 7 to our consolidated financial statements for... -
Page 69
... systems in developed markets; expanding shared services; and implementing simplified organization structures to drive efficiency. The 2014 Productivity Plan is in addition to the productivity plan we began implementing in 2012 and is expected to continue the benefits of that plan. In 2014 and 2013... -
Page 70
... our complementary food, snack and beverage businesses by: leveraging new technologies and processes across PepsiCo's operations, go-to-market and information systems; heightening the focus on best practice sharing across the globe; consolidating manufacturing, warehouse and sales facilities; and... -
Page 71
... per share. For additional information on Venezuela, see "Our Business Risks." Tax Benefits In 2013, we recognized a non-cash tax benefit of $209 million ($0.13 per share) associated with our agreement with the IRS resolving all open matters related to the audits for taxable years 2003 through 2009... -
Page 72
... Review In the discussions of net revenue and operating profit below, "effective net pricing" reflects the year-overyear impact of discrete pricing actions, sales incentive activities and mix resulting from selling varying products in different package sizes and in different countries and "net... -
Page 73
...points and total operating margin by 0.6 percentage points. 2013 On a reported basis, total operating profit increased 7% and operating margin increased 0.7 percentage points. Operating profit growth was primarily driven by effective net pricing and planned cost reductions across a number of expense... -
Page 74
... gains on the market value of investments used to economically hedge a portion of our deferred compensation costs, partially offset by higher interest income due to higher average cash balances. The reported tax rate increased 1.4 percentage points, primarily due to lapping the prior year impact of... -
Page 75
... on the market value of investments used to economically hedge a portion of our deferred compensation costs. The reported tax rate decreased 1.5 percentage points compared to the prior year, due to resolution with the IRS of audits for taxable years 2003 through 2009, the favorable tax effects of... -
Page 76
...year-over-year impact of discrete pricing actions, sales incentive activities and mix resulting from selling varying products in different package sizes and in different countries. (c) Amounts may not sum due to rounding. Organic Revenue Growth Organic revenue growth is a significant measure we use... -
Page 77
... partially offset by certain operating cost increases including strategic initiatives. 2013 Net revenue grew 4% and volume grew 3%. Net revenue growth was driven by the volume growth and effective net pricing. The volume growth reflects high-single-digit growth in trademark Cheetos and in variety... -
Page 78
... and marketing expenses. Additionally, the net gain on the divestiture of a cereal business contributed 3 percentage points to operating profit growth. These impacts were partially offset by the unfavorable net pricing and mix, as well as certain operating cost increases. 2013 Net revenue declined... -
Page 79
.... Reported operating profit performance included a contribution of 6 percentage points from the results of our Venezuela business. For additional information on Venezuela, see "Market Risks" in "Our Business Risks." 2013 Net revenue increased 7%, primarily reflecting favorable effective net pricing... -
Page 80
... in our juice and juice drinks portfolio. Reported operating profit decreased 4%. Excluding the items affecting comparability in the above table (see "Items Affecting Comparability"), operating profit increased 1%. This increase primarily reflects the favorable effective net pricing, planned cost... -
Page 81
... effective net pricing and planned cost reductions across a number of expense categories, as well as lower commodity costs, which increased reported operating profit by 6 percentage points. Unfavorable foreign exchange reduced operating profit growth by 3 percentage points. PepsiCo Europe 2014... -
Page 82
... operating profit performance by 1.5 percentage points. PepsiCo Asia, Middle East and Africa 2014 2013 2012 $ 6,727 $ 6,507 $ 6,653 % Change 2014 2013 3 (2) 3 4 6 2 (11) 57 Net revenue Impact of foreign exchange translation Net revenue growth, on a constant currency basis(a) Operating profit... -
Page 83
... and high-single-digit growth in Thailand and the Middle East, partially offset by a mid-single-digit decline in Australia. Additionally, India experienced mid-single-digit growth. Beverage volume grew 12%, driven by double-digit growth in China (including the co-branded juice products distributed... -
Page 84
... impact on our business, financial condition or results of operations." in "Risk Factors" in Item 1A. As of December 27, 2014, we had cash, cash equivalents and short-term investments of $7.4 billion outside the U.S. In the fourth quarter of 2014, we remitted $6 billion of international cash to the... -
Page 85
... financial statements for further discussion of our marketable debt securities. During 2013, net cash used for investing activities was $2.6 billion, primarily reflecting $2.7 billion for net capital spending. We expect 2015 net capital spending to be approximately $3 billion, within our long-term... -
Page 86
... "Our borrowing costs and access to capital and credit markets may be adversely affected by a downgrade or potential downgrade of our credit ratings." in "Risk Factors" in Item 1A, "Our Business Risks" and Note 9 to our consolidated financial statements. Credit Facilities and Long-Term Contractual... -
Page 87
Table of Contents Consolidated Statement of Income PepsiCo, Inc. and Subsidiaries Fiscal years ended December 27, 2014, December 28, 2013 and December 29, 2012 (in millions except per share amounts) 2014 66,683 $ 30,884 35,799 26,126 92 9,581 (909) 85 8,757 2,199 6,558 45 6,513 $ 4.31 $ 4.27 $ 1,... -
Page 88
Table of Contents Consolidated Statement of Comprehensive Income PepsiCo, Inc. and Subsidiaries Fiscal years ended December 27, 2014, December 28, 2013 and December 29, 2012 (in millions) 2014 Pre-tax amounts Net income Other Comprehensive Loss Currency translation adjustment Cash flow hedges: ... -
Page 89
Table of Contents Consolidated Statement of Cash Flows PepsiCo, Inc. and Subsidiaries Fiscal years ended December 27, 2014, December 28, 2013 and December 29, 2012 (in millions) 2014 Operating Activities Net income Depreciation and amortization Stock-based compensation expense Merger and ... -
Page 90
... Contents Consolidated Statement of Cash Flows (continued) PepsiCo, Inc. and Subsidiaries Fiscal years ended December 27, 2014, December 28, 2013 and December 29, 2012 (in millions) 2014 Financing Activities Proceeds from issuances of long-term debt Payments of long-term debt Short-term borrowings... -
Page 91
... PepsiCo, Inc. and Subsidiaries December 27, 2014 and December 28, 2013 (in millions except per share amounts) 2014 ASSETS Current Assets Cash and cash equivalents Short-term investments Accounts and notes receivable, net Inventories Prepaid expenses and other current assets Total Current Assets... -
Page 92
...Consolidated Statement of Equity PepsiCo, Inc. and Subsidiaries Fiscal years ended December 27, 2014, December 28, 2013 and December 29, 2012 (in millions) Preferred Stock Repurchased Preferred Stock Balance, beginning of year Redemptions Balance, end of year Common Stock Balance, beginning of year... -
Page 93
... "Our Liquidity and Capital Resources" in Management's Discussion and Analysis of Financial Condition and Results of Operations. Raw materials, direct labor and plant overhead, as well as purchasing and receiving costs, costs directly related to production planning, inspection costs and raw material... -
Page 94
... bottlers, contract manufacturers and other third parties, we make, market, sell and distribute a wide variety of convenient and enjoyable foods and beverages, serving customers and consumers in more than 200 countries and territories with our largest operations in North America, Russia, Mexico... -
Page 95
...4% 2014 Division Operating Profit AMEA 9% FLNA 36% Europe 20% Europe 12% PAB 32% LAF 12% PAB 26% QFNA 6% LAF 11% Corporate Corporate unallocated includes costs of our corporate headquarters, centrally managed initiatives such as research and development... -
Page 96
... assets, partially offset by an increase in short-term investments. 2014 Total Assets AMEA 8% Corporate FLNA QFNA 13% 8% 1% 2014 Capital Spending Corporate FLNA 6% 18% AMEA 18% QFNA 2% LAF 13% LAF 7% Europe 20% PAB 43% Europe 18% PAB... -
Page 97
... policies, including our policy on bad debts, see "Our Critical Accounting Policies" in Management's Discussion and Analysis of Financial Condition and Results of Operations. We are exposed to concentration of credit risk from our customers, including Wal-Mart. In 2014, sales to Wal-Mart (including... -
Page 98
..."Our Critical Accounting Policies" in Management's Discussion and Analysis of Financial Condition and Results of Operations. Advertising and other marketing activities, reported as selling, general and administrative expenses, totaled $3.9 billion in 2014 and 2013 and $3.7 billion in 2012, including... -
Page 99
... expected future levels of sales and operating profit which are inputs from our annual long-range planning process that are used to estimate future cash flows. Additionally, they are also impacted by estimates of discount rates, perpetuity growth assumptions and other factors. Significant management... -
Page 100
... Intangible Assets - Note 4. Income Taxes - Note 5, and for additional unaudited information see "Our Critical Accounting Policies" in Management's Discussion and Analysis of Financial Condition and Results of Operations. Stock-Based Compensation - Note 6. Pension, Retiree Medical and Savings Plans... -
Page 101
... go-to-market systems in developed markets; expanding shared services; and implementing simplified organization structures to drive efficiency. The 2014 Productivity Plan is in addition to the 2012 Productivity Plan and is expected to continue the benefits of that plan. In 2014 and 2013, we incurred... -
Page 102
... our complementary food, snack and beverage businesses by: leveraging new technologies and processes across PepsiCo's operations, go-to-market and information systems; heightening the focus on best practice sharing across the globe; consolidating manufacturing, warehouse and sales facilities; and... -
Page 103
...A summary of our 2012 Productivity Plan charges is as follows: 2014 Severance and Other Employee Costs FLNA (a) QFNA LAF PAB Europe AMEA Corporate (a) $ (a) 2013 Severance and Other Employee Costs $ 4 - 5 8 36 21 - $ 74 $ Severance and Other Employee Costs $ 14 - 15 34 14 18 (6) $ 89 $ 2012 Asset... -
Page 104
...466) $ 1,638 2012 Gross $ 879 107 1,361 595 2,942 Amortization of intangible assets for each of the next five years, based on existing intangible assets as of December 27, 2014 and using average 2014 foreign exchange rates, is expected to be as follows: 2015 Five-year projected amortization $ 82... -
Page 105
... operating results of PAB's CSD business do not achieve our estimated future cash flows or if macroeconomic conditions result in a future increase in the weighted-average cost of capital used to estimate fair value. We have also analyzed the impact of the recent economic and political developments... -
Page 106
...book value of nonamortizable intangible assets is as follows: Balance, Beginning 2013 FLNA Goodwill Brands QFNA Goodwill LAF Goodwill Brands PAB Goodwill Reacquired franchise rights Acquired franchise rights Brands Europe (a) Goodwill Reacquired franchise rights Acquired franchise rights Brands AMEA... -
Page 107
... Federal statutory tax rate to our annual tax rate is as follows: U.S. Federal statutory tax rate State income tax, net of U.S. Federal tax benefit Lower taxes on foreign results Tax benefits Other, net Annual tax rate 2014 35.0% 0.6 (8.6) - (1.9) 25.1% 2013 35.0% 1.2 (8.8) (2.4) (1.3) 23.7% 2012 35... -
Page 108
...nondeductible goodwill Other Gross deferred tax liabilities Deferred tax assets Net carryforwards Stock-based compensation Retiree medical benefits Other employee-related benefits Pension benefits Deductible state tax and interest benefits Long-term debt obligations acquired Other Gross deferred tax... -
Page 109
...non-cash tax benefit of $217 million in the fourth quarter of 2012. See additional unaudited information in "Items Affecting Comparability" in Management's Discussion and Analysis of Financial Condition and Results of Operations. As of December 27, 2014, the total gross amount of reserves for income... -
Page 110
... granted to employees under the shareholder-approved 2007 Long-Term Incentive Plan (LTIP). Each RSU represents our obligation to deliver to the holder one share of PepsiCo common stock when the award vests at the end of the service period. PSUs are awards where the number of shares delivered to the... -
Page 111
...benefits Total Income tax benefits recognized in earnings related to stock-based compensation Method of Accounting and Our Assumptions We account for our employee stock options under the fair value method of accounting using a Black-Scholes valuation model to measure stock option expense at the date... -
Page 112
... over the expected life based on our stated dividend policy and forecasts of net income, share repurchases and stock price. A summary of our stock-based compensation activity for the year ended December 27, 2014 is as follows: Our Stock Option Activity Outstanding at December 28, 2013 Granted... -
Page 113
... under the PepsiCo Director Deferral Program and will be settled in shares of PepsiCo common stock pursuant to the LTIP at the end of the applicable deferral period, not included in the tables above. As of December 27, 2014, there was $382 million of total unrecognized compensation cost related to... -
Page 114
...Note 7 - Pension, Retiree Medical and Savings Plans In the fourth quarter of 2014 and 2012, the Company offered certain former employees who had vested benefits in our U.S. defined benefit pension plans the option of receiving a one-time lump sum payment equal to the present value of the participant... -
Page 115
... cost Plan amendments Participant contributions Experience loss/(gain) Benefit payments Settlement/curtailment Special termination benefits Foreign currency adjustment Other Liability at end of year Change in fair value of plan assets Fair value at beginning of year Actual return on plan assets... -
Page 116
... of benefit expense Service cost Interest cost Expected return on plan assets Amortization of prior service cost/(credit) Amortization of net loss/(gain) Settlement/curtailment loss/(gain)(a) Special termination benefits Total 2013 2012 International 2014 2013 2012 2014 2013 2012 Retiree Medical... -
Page 117
...2012 2014 International 2013 2012 2014 2013 2012 Retiree Medical The following table provides selected information about plans with liability for service to date and total projected benefit liability in excess of plan assets: Pension U.S. 2014 Liability for service to date Fair value of plan assets... -
Page 118
... which are primarily used to reduce risk. Our expected long-term rate of return on U.S. plan assets is 7.5% for 2015 and 2014. Our target investment allocations for U.S. plan assets are as follows: Fixed income U.S. equity International equity Real estate 2015 40% 33% 22% 5% 2014 40% 33% 22... -
Page 119
... of Contents Contributions to our pension and retiree medical plans were as follows: Pension 2014 Discretionary (a) Non-discretionary Total $ $ 407 184 591 $ $ 2013 23 177 200 $ $ 2012 1,375 239 1,614 $ $ 2014 - 64 64 $ $ Retiree Medical 2013 - 62 62 $ $ 2012 140 111 251 (a) Includes $388 million... -
Page 120
...at fair value as of fiscal year-end 2014 and 2013 are categorized consistently by level in both years, and are as follows: 2014 Significant Quoted Prices in Other Active Markets for Observable Identical Assets Inputs (Level 2) (Level 1) 2013 Significant Unobservable Inputs (Level 3) Total U.S. plan... -
Page 121
... of 2013 635 40 675 Return on Assets Held at Year-End $ $ 68 2 70 Purchases and Sales, Net $ $ 18 - 18 Balance, End of 2014 $ 721 42 $ 763 56 $ (1) 55 $ 188 $ (21) 167 $ Retiree Medical Cost Trend Rates An average increase of 6% in the cost of covered retiree medical benefits is assumed for 2015... -
Page 122
... sell finished goods (ready-to-drink teas and coffees, respectively) to us and our noncontrolled bottling affiliates. Consistent with accounting for equity method investments, our joint venture revenue is not included in our consolidated net revenue. Certain members of our Board of Directors... -
Page 123
...,857 Long-term debt obligations(b) Interest on debt obligations(c) Operating leases Purchasing commitments(d) Marketing commitments(d) (a) Based on year-end foreign exchange rates. We expect to make net cash tax payments of approximately $300 million within the next 12 months, as discussed further... -
Page 124
... value hedges and qualify for hedge accounting treatment, while others do not qualify and are marked to market through earnings. Cash flows from derivatives used to manage commodity price, foreign exchange or interest rate risks are classified as operating activities in the Consolidated Statement... -
Page 125
..., 2014, approximately 25% of total debt, after the impact of the related interest rate derivative instruments, was exposed to variable rates, compared to 31% as of December 28, 2013. Available-for-Sale Securities Investments in debt and equity marketable securities, other than investments accounted... -
Page 126
... gains and losses related to changes in the fair value of available-for-sale securities are recognized in accumulated other comprehensive loss within common shareholders' equity. Unrealized gains and losses on our investments in marketable debt securities as of December 27, 2014 were not material... -
Page 127
... All of the Company's available-for-sale debt securities have contractual maturities of one year or less. (d) Based on the price of index funds. Categorized as a Level 1 asset. These investments are classified as short-term investments and are used to manage a portion of market risk arising from our... -
Page 128
... amounts of our cash and cash equivalents and short-term investments approximate fair value due to their short-term maturity. The fair value of our debt obligations as of December 27, 2014 and December 28, 2013 was $31 billion and $30 billion, respectively, based upon prices of similar instruments... -
Page 129
... stock accrues dividends at an annual rate of $5.46 per share. As of December 27, 2014 and December 28, 2013, there were 803,953 preferred shares issued and 145,453 and 167,053 shares outstanding, respectively. The outstanding preferred shares had a fair value of $70 million as of December 27, 2014... -
Page 130
... Statement of Income for the years ended December 27, 2014 and December 28, 2013: 2014 2013 Affected Line Item in the Consolidated Statement of Income Amount Reclassified from Accumulated Other Comprehensive Loss (Gains)/Losses on cash flow hedges: Foreign exchange contracts Interest rate... -
Page 131
...summarized as follows: 2014 Accounts and notes receivable Trade receivables Other receivables Allowance, beginning of year Net amounts charged to expense Deductions (a) Other (b) Allowance, end of year Net receivables Inventories (c) Raw materials Work-in-process Finished goods $ $ $ 5,817 971 6,788... -
Page 132
.... See additional unaudited information in "Items Affecting Comparability" in Management's Discussion and Analysis of Financial Condition and Results of Operations. Suntory Holdings Limited During our second quarter of 2013, as part of the refranchising of our beverage business in Vietnam, we... -
Page 133
... Audit Committee of the Board of Directors has engaged independent registered public accounting firm, KPMG LLP, to audit our consolidated financial statements, and they have expressed an unqualified opinion. We are committed to providing timely, accurate and understandable information to investors... -
Page 134
... financial reporting. February 12, 2015 /s/ MARIE T. GALLAGHER Marie T. Gallagher Senior Vice President and Controller /s/ HUGH F. JOHNSTON Hugh F. Johnston Executive Vice President and Chief Financial Officer /s/ INDRA K. NOOYI Indra K. Nooyi Chairman of the Board of Directors and Chief Executive... -
Page 135
... December 27, 2014 and December 28, 2013, and the related Consolidated Statements of Income, Comprehensive Income, Cash Flows and Equity for each of the fiscal years in the three-year period ended December 27, 2014. We also have audited PepsiCo, Inc.'s internal control over financial reporting as of... -
Page 136
..., the consolidated financial statements referred to above present fairly, in all material respects, the financial position of PepsiCo, Inc. as of December 27, 2014 and December 28, 2013, and the results of its operations and its cash flows for each of the fiscal years in the three-year period ended... -
Page 137
... accrued in the first three quarters of 2013; this reduction was more than offset by other tax related adjustments in the fourth quarter of 2013. See Note 5 to our consolidated financial statements. (h) Represents the composite high and low sales price for one share of PepsiCo common stock. 117 -
Page 138
...common $ share - diluted Cash dividends declared per common share $ Total assets $ Long-term debt Return on invested capital(a) $ (a) Return on invested capital is defined as adjusted net income attributable to PepsiCo divided by the sum of average common shareholders' equity and average total debt... -
Page 139
...income attributable to PepsiCo by $64 million or $0.04 per share. In 2011, we recorded $46 million ($28 million after-tax or $0.02 per share) of incremental costs related to fair value adjustments to the acquired inventory included in WBD's balance sheet at the acquisition date and hedging contracts... -
Page 140
.... Effective net pricing: reflects the year-over-year impact of discrete pricing actions, sales incentive activities and mix resulting from selling varying products in different package sizes and in different countries. Free cash flow: net cash provided by operating activities less capital spending... -
Page 141
...products. Total marketplace spending: includes sales incentives and discounts offered through various programs to our customers, consumers or independent bottlers, as well as advertising and other marketing activities. Transaction gains and losses: the impact on our consolidated financial statements... -
Page 142
...Internal Control over Financial Reporting. During our fourth fiscal quarter of 2014, we continued migrating certain of our financial processing systems to an enterprise-wide systems solution. These systems implementations are part of our ongoing global business transformation initiative, and we plan... -
Page 143
... for Issuance Under Equity Compensation Plans" in our 2015 Proxy Statement and is incorporated herein by reference. Information on the number of shares of PepsiCo Common Stock beneficially owned by each director and named executive officer, by all directors and executive officers as a group and on... -
Page 144
... the captions "Corporate Governance at PepsiCo - Related Person Transactions" and "Corporate Governance at PepsiCo - Director Independence" in our 2015 Proxy Statement and is incorporated herein by reference. Item 14. Principal Accounting Fees and Services. Information on our Audit Committee's pre... -
Page 145
... 7. Management's Discussion and Analysis of Financial Condition and Results of Operations": Consolidated Statement of Income - Fiscal years ended December 27, 2014, December 28, 2013 and December 29, 2012 Consolidated Statement of Comprehensive Income - Fiscal years ended December 27, 2014, December... -
Page 146
...(d) of the Securities Exchange Act of 1934, PepsiCo has duly caused this report to be signed on its behalf by the undersigned, thereunto duly authorized. Dated: February 12, 2015 PepsiCo, Inc. By: /s/ Indra K. Nooyi Indra K. Nooyi Chairman of the Board of Directors and Chief Executive Officer 126 -
Page 147
... Board of Directors and Chief Executive Officer Executive Vice President and Chief Financial Officer Senior Vice President and Controller (Principal Accounting Officer) Director Director Director Director Director Director Director Director Director Director Director Director DATE February 12, 2015... -
Page 148
... the rights of holders of long-term debt of PepsiCo, Inc. and all of its subsidiaries for which consolidated or unconsolidated financial statements are required to be filed with the Securities and Exchange Commission. Indenture dated May 21, 2007 between PepsiCo, Inc. and The Bank of New York Mellon... -
Page 149
... Inc.'s Quarterly Report on Form 10-Q for the 24 weeks ended June 12, 2010. Form of 2.500% Senior Note due 2016, which is incorporated herein by reference to Exhibit 4.2 to PepsiCo, Inc.'s Current Report on Form 8-K filed with the Securities and Exchange Commission on May 6, 2011. Board of Directors... -
Page 150
...Exhibit 4.2 to PepsiCo, Inc.'s Current Report on Form 8-K filed with the Securities and Exchange Commission on July 30, 2013. First Supplemental Indenture, dated as of February 26, 2010, among Pepsi-Cola Metropolitan Bottling Company, Inc., The Pepsi Bottling Group, Inc., Bottling Group, LLC and The... -
Page 151
... due 2026, which is incorporated herein by reference to Exhibit 4.8 to PepsiCo, Inc.'s Quarterly Report on Form 10-Q for the quarterly period ended March 20, 2010. First Supplemental Indenture, dated as of February 26, 2010, among Pepsi-Cola Metropolitan Bottling Company, Inc., PepsiAmericas, Inc... -
Page 152
...2010. PepsiCo, Inc. 1994 Long-Term Incentive Plan, as amended and restated, effective October 1, 1999, which is incorporated herein by reference to Exhibit 10.6 to PepsiCo, Inc.'s Annual Report on Form 10-K for the fiscal year ended December 25, 1999.* PepsiCo Executive Income Deferral Program (Plan... -
Page 153
... 10-Q for the fiscal quarter ended September 6, 2008.* PepsiCo, Inc. Executive Incentive Compensation Plan, which is incorporated herein by reference to Exhibit B to PepsiCo, Inc.'s Proxy Statement for its 2009 Annual Meeting of Shareholders filed with the Securities and Exchange Commission on March... -
Page 154
..., the PepsiCo SharePower Stock Option Plan and the PepsiCo, Inc. 1987 Incentive Plan, effective as of February 2, 2007, which is incorporated herein by reference to Exhibit 10.41 to PepsiCo, Inc.'s Annual Report on Form 10-K for the fiscal year ended December 30, 2006.* Form of Pro Rata Long-Term... -
Page 155
....'s Quarterly Report on Form 10-Q for the fiscal quarter ended June 13, 2009.* PBG 2004 Long Term Incentive Plan, which is incorporated herein by reference to Exhibit 99.1 to PepsiCo, Inc.'s Registration Statement on Form S-8 as filed with the Securities and Exchange Commission on February 26, 2010... -
Page 156
... Pepsi Bottling Group, Inc. 1999 Long Term Incentive Plan, PBG Directors' Stock Plan and PBG Stock Incentive Plan (effective February 19, 2010), which are incorporated herein by reference to Exhibit 99.8 to PepsiCo, Inc.'s Registration Statement on Form S-8 as filed with the Securities and Exchange... -
Page 157
... quarterly period ended September 3, 2011.* The PepsiCo International Retirement Plan Defined Benefit Program, as amended and restated effective as of January 1, 2010, which is incorporated herein by reference to Exhibit 10.68 to PepsiCo, Inc.'s Annual Report on Form 10-K for the fiscal year ended... -
Page 158
... 409A Program and Plan Document for the Pre-409A Program), generally effective as of January 1, 2013, which is incorporated herein by reference to Exhibit 10.77 to PepsiCo, Inc.'s Annual Report on Form 10-K for the fiscal year ended December 28, 2013.* PepsiCo, Inc. 2007 Long-Term Incentive Plan, as... -
Page 159
... Annual Report on Form 10-K for the fiscal year ended December 27, 2014 formatted in XBRL (eXtensible Business Reporting Language): (i) the Consolidated Statement of Income, (ii) the Consolidated Statement of Comprehensive Income, (iii) the Consolidated Statement of Cash Flows, (iv) the Consolidated... -
Page 160
page intentionally left blank -
Page 161
... our complementary food, snack and beverage businesses by: leveraging new technologies and processes across PepsiCo's operations, go-to-market and information systems; heightening the focus on best practice sharing across the globe; consolidating manufacturing, warehouse and sales facilities; and... -
Page 162
... Resources - Free Cash Flow" in Management's Discussion and Analysis for a reconciliation to the most directly comparable financial measure in accordance with U.S. GAAP. Return on Invested Capital (ROIC) Growth Reconciliation Reported ROIC Growth Impact of: Cash, Cash Equivalents and Short-Term... -
Page 163
... of Cumulative Total Shareholder Return Return on PepsiCo stock investment (including dividends), the S&P 500 and the S&P Average of Industry Groups* in U.S. dollars PepsiCo, Inc. 200 S&P 500 S&P Avg. of Ind. Groups* 175 150 125 100 2009 2010 2011 2012 2013 2014 PepsiCo, Inc. S&P 500... -
Page 164
... address and your telephone number. The closing price for a share of PepsiCo common stock on the New York Stock Exchange was the price as reported by Bloomberg for the years ending 2010-2014. Past performance is not necessarily indicative of future returns on investments in PepsiCo common stock. -
Page 165
...us.computer share.com/investor/contact Other services include dividend reinvestment, direct deposit of dividends, optional cash investments by electronic funds transfer or check drawn on a U.S. bank, sale of shares, online account access, and electronic delivery of shareholder materials. Additional... -
Page 166