O'Reilly Auto Parts 2006 Annual Report Download - page 2
Download and view the complete annual report
Please find page 2 of the 2006 O'Reilly Auto Parts annual report below. You can navigate through the pages in the report by either clicking on the pages listed below, or by using the keyword search tool below to find specific information within the annual report.-
 1
1 -
 2
2 -
 3
3 -
 4
4 -
 5
5 -
 6
6 -
 7
7 -
 8
8 -
 9
9 -
 10
10 -
 11
11 -
 12
12 -
 13
13 -
14
-
15
-
16
-
17
-
18
-
19
-
20
-
21
-
22
-
23
-
24
-
25
-
26
-
27
-
28
-
29
-
30
-
31
-
32
-
33
-
34
-
35
-
36
-
37
-
38
-
39
-
40
-
41
-
42
-
43
-
44
-
45
-
46
-
47
-
48
 |
 |

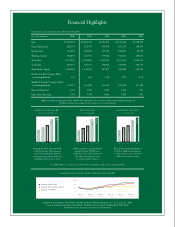
Financial Highlights
In thousands, except earnings per share data and operating data
years ended december 31 2006 2005 2004 2003 2002
Sales $2,283,222 $2,045,318 $1,721,241 $1,511,816 $1,312,490
Operating Income 282,315 252,524 190,458 165,275 138,301
Net Income(a) 178,085 164,266 117,674 100,087 81,992
Working Capital 566,892 424,974 479,662 441,617 483,623
Total Assets 1,977,496 1,718,896 1,432,357 1,157,033 1,009,419
Total Debt 110,479 100,774 100,914 121,902 191,152
Shareholders' Equity 1,364,096 1,145,769 947,817 784,285 650,524
Net Income Per Common Share
(assuming dilution)(a) 1.55 1.45 1.05 0.92 0.76
Weighted-Average Common Shares
(assuming dilution) 155,119 113,385 111,423 109,060 107,384
Stores At Year-End 1,640 1,470 1,249 1,109 981
Same-Store Sales Gain 3.3% 7.5% 6.8% 7.8% 3.7%
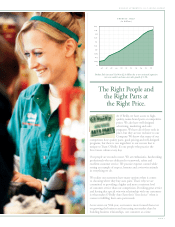
Earnings Per Share increased 6.9%
to $1.55 per share. We continued
our focus on profitable growth by
scrutinizing every expense while not
sacrificing customer service levels.
earnings per share(a)
(assuming dilution)
We posted an Operating Margin of
12.4% in 2006 as a result of our
excellent customer service and strict
adherence to expense control
operating income(a)
(in thousands)
2006 was another year of profitable
growth for Team O’Reilly as we
reached new levels of Net Income for
the 14th consecutive year since
becoming a public company.
net income(a)
(in thousands)
(a) 2004 figures are based on income before cumulative effect of accounting change.
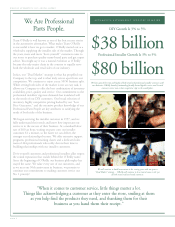
2006 was another strong year for Team O’Reilly. We continued to drive increases in sales and profitability through our
relentless attention to providing the best customer service in the business.
comparison of five-year cumulative return
Comparison of Cumulative Total Return on $100 invested in O’Reilly Automotive, Inc. on December 31, 2001,
versus the Nasdaq United States Stock Market Total Return Index and The Nasdaq Retail Trade Stocks
Total Return Index, assuming reinvestment of all dividends.
o’reilly auto parts
nasdaq retail trade stocks
nasdaq us market 50
150
$ 200
dc. 31,
2001
dc. 31,
2002
dc. 31,
2003
dc. 31,
2004
dc. 31,
2005
dc. 31,
2006
100