National Grid 2013 Annual Report Download - page 67
Download and view the complete annual report
Please find page 67 of the 2013 National Grid annual report below. You can navigate through the pages in the report by either clicking on the pages listed below, or by using the keyword search tool below to find specific information within the annual report.-
 1
1 -
2
-
3
-
4
-
5
-
6
-
7
-
8
-
9
-
10
-
11
-
12
-
13
-
14
-
15
-
16
-
17
-
18
-
19
-
20
-
21
-
22
-
23
-
24
-
25
-
26
-
27
-
28
-
29
-
30
-
31
-
32
-
33
-
34
-
35
-
36
-
37
-
38
-
39
-
40
-
41
-
42
-
43
-
44
-
45
-
46
-
47
-
48
-
49
-
50
-
51
-
52
-
53
-
54
-
55
-
56
-
 57
57 -
 58
58 -
 59
59 -
 60
60 -
 61
61 -
 62
62 -
 63
63 -
 64
64 -
 65
65 -
 66
66 -
 67
67 -
 68
68
 |
 |

66
executive share-based incentives and will not exceed 10% in any 10-year period for all employee incentives. This is
reviewed by the Remuneration Committee and currently, the Company has excess headroom of 4.07% and 7.75%
respectively.
The number of units within each award is subject to change depending upon the Company’ s ability to meet the stated
performance targets. Under the LTPP, performance conditions are split into three parts as follows: (i) 50% of the units
awarded are subject to annualized growth in the Company’ s earnings per share (“EPS”) over a general index of retail
prices over a period of three years; (2) 25% of the units awarded will vest based upon the Company’ s Total Shareholder
Return (“TSR”) compared to that of the Financial Times Stock Exchange (“FTSE”) 100 over a period of three years; and
(3) 25% of the units awarded are subject to the average achieved regulatory ROE. Under the PSP, performance
conditions are split into two parts as follows: (1) 50% of the units awarded are subject to annualized growth in the
Company’ s EPS over a general index of retail prices over a period of three years; and (2) 50% of the units awarded will
vest based upon the Company’ s TSR compared to that of the FTSE 100 over a period of three years. Units under both
plans generally vest at the end of the performance period.
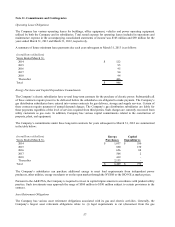
Fair value of the performance restricted stock of the PSP units is calculated at the end of each fiscal year. Fair value for
the LTPP awards is calculated as of the grant date and at the end of each period. A Monte Carlo simulation model has
been used to estimate the fair value for the TSR portion of the awards. For the EPS and ROE portions of the awards, the
fair value of the award is determined using the stock price as quoted per the London Stock Exchange or the price for the
American Depository Shares as quoted on the New York Stock Exchange as of the earlier of the reporting date or vesting
date.
The following table represents the assumptions used to calculate the fair value of the TSR portion of the awards:
Expected volatility
12.72% - 14.48%
Expected term 3 years
Risk free rates 0.07% - 0.26%
The EPS portions of the PSP and LTTP awards and the ROE portion of the LTTP awards are classified as liability
awards as they are each indexed to a factor that is not a market, performance, or service condition. Therefore, the
changes in the fair value of the EPS portions of the PSP and EPS and ROE portions of the LTTP awards are reflected
within net income. The TSR portions of the PSP and LTTP awards are classified as equity awards as they are indexed to
market conditions, and are expensed over the performance period.
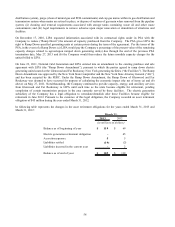
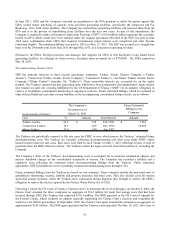
The following table summarizes the stock based compensation expense recognized by the Company for the years ended
March 31, 2013 and March 31, 2012:
Units
Nonvested as of March 31, 2011 1,081,801 45.42$
Vested 179,612 53.92
Granted 310,468 42.19
Forfeited/Cancelled 197,117 51.26
Nonvested as of March 31, 2012 1,015,540 42.19
Vested 119,468 45.53
Granted 272,274 48.29
Forfeited/Cancelled 222,401 42.97
Nonvested as of March 31, 2013 945,945 40.36$
Weighted
Average Grant
Date Fair Value
The total expense recognized for unvested awards was $24.7 million and $12.3 million for the years ended March 31,
2013 and March 31, 2012 respectively, and will vest over three years. The total tax benefit recorded was approximately
$9.9 million and $4.9 million as of March 31, 2013 and March 31, 2012 respectively. Total expense expected to be
recognized by the Company in future periods for unvested awards outstanding as of March 31, 2013 is $9.0 million, $5.2
million, and $1.0 million for the years ended March 31, 2014, 2015, and 2016 respectively.