National Grid 2013 Annual Report Download - page 34
Download and view the complete annual report
Please find page 34 of the 2013 National Grid annual report below. You can navigate through the pages in the report by either clicking on the pages listed below, or by using the keyword search tool below to find specific information within the annual report.-
 1
1 -
2
-
3
-
4
-
5
-
6
-
7
-
8
-
9
-
10
-
11
-
12
-
13
-
14
-
15
-
16
-
17
-
18
-
19
-
20
-
21
-
22
-
23
-
 24
24 -
 25
25 -
 26
26 -
 27
27 -
 28
28 -
 29
29 -
 30
30 -
 31
31 -
 32
32 -
 33
33 -
 34
34 -
 35
35 -
 36
36 -
 37
37 -
 38
38 -
 39
39 -
 40
40 -
 41
41 -
 42
42 -
 43
43 -
 44
44 -
45
-
46
-
47
-
48
-
49
-
50
-
51
-
52
-
53
-
54
-
55
-
56
-
57
-
58
-
59
-
60
-
61
-
62
-
63
-
64
-
65
-
66
-
67
-
68
 |
 |

33
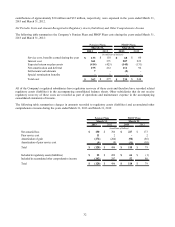
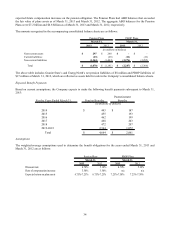
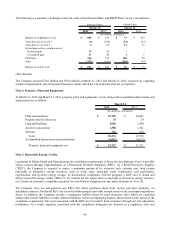
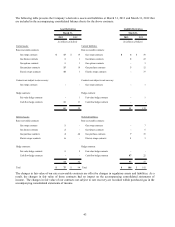
The following table summarizes the Company’ s amounts in regulatory assets and accumulated other comprehensive
income in the accompanying consolidated balance sheets that have not yet been recognized as components of net
actuarial loss at March 31, 2013 and March 31, 2012, and the amount expected to be amortized during the year ended
March 31, 2014:
March 31,
2013 2012 2013 2012 2014
Cumulative loss
1,966$ 2,088$ 905$ 776$ 348$
Prior service cost
56 54 17 27 38
Total 2,022$ 2,142$ 922$ 803$ 386$
Included in regulatory assets 1,067$ 1,045$ 459$ 393$
Included in accumulated other comprehensive income 955 1,097 463 410
Total 2,022$ 2,142$ 922$ 803$
Pension Plans PBOP Plans
(in millions of dollars)
Expected
Amortization
March 31, March 31,
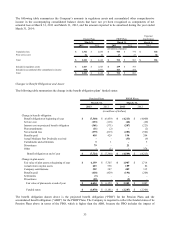
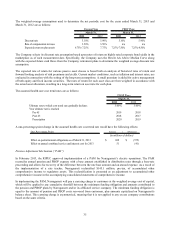
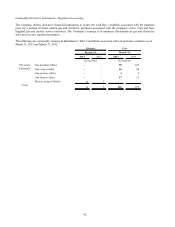
Changes in Benefit Obligations and Assets
The following table summarizes the change in the benefit obligation plans’ funded status:
2013 2012 2013 2012
Change in benefit obligation:
Benefit obligation at beginning of year (7,340)$ (6,459)$ (4,213)$ (4,000)$
Service cost (133) (118) (68) (60)
Interest cost on projected benefit obligation (361) (371) (207) (223)
Plan amendments (11) (2) -(2)
Net actuarial loss (379) (819) (283) (502)
Benefits paid 418 429 194 204
Actual Medicare Part D subsidy received --(33) (9)
Curtailments and settlements 31-5
Divestitures 79 -21 -
Other -(1) -374
Benefit obligation at end of year (7,724)$ (7,340)$ (4,589)$ (4,213)$
Change in plan assets:
Fair value of plan assets at beginning of year 6,159$ 5,705$ 1,907$ 1,714$
Actual return on plan assets 623 536 189 82
Company contributions 352 347 409 315
Benefits paid (418) (429) (194) (204)
Settlements (3) ---
Divestitures (59) -(9) -
Fair value of plan assets at end of year 6,654$ 6,159$ 2,302$ 1,907$
Funded status (1,070)$ (1,181)$ (2,287)$ (2,306)$
March 31, March 31,
Pension Plans PBOP Plans
(in millions of dollars)
The benefit obligation shown above is the projected benefit obligation (“PBO”) for the Pension Plans and the
accumulated benefit obligation (“ABO”) for the PBOP Plans. The Company is required to reflect the funded status of its
Pension Plans above in terms of the PBO, which is higher than the ABO, because the PBO includes the impact of