Mitsubishi 2014 Annual Report Download - page 9
Download and view the complete annual report
Please find page 9 of the 2014 Mitsubishi annual report below. You can navigate through the pages in the report by either clicking on the pages listed below, or by using the keyword search tool below to find specific information within the annual report.-
 1
1 -
 2
2 -
 3
3 -
 4
4 -
 5
5 -
 6
6 -
 7
7 -
 8
8 -
 9
9 -
 10
10 -
 11
11 -
 12
12 -
 13
13 -
 14
14 -
 15
15 -
 16
16 -
 17
17 -
 18
18 -
 19
19 -
 20
20 -
21
-
22
-
23
-
24
-
25
-
26
-
27
-
28
-
29
-
30
-
31
-
32
-
33
-
34
-
35
-
36
-
37
-
38
-
39
-
40
-
41
-
42
-
43
-
44
-
45
-
46
-
47
-
48
-
49
-
50
-
51
-
52
-
53
-
54
-
55
-
56
-
57
-
58
-
59
-
60
-
61
-
62
-
63
-
64
-
65
-
66
-
67
-
68
-
69
-
70
 |
 |

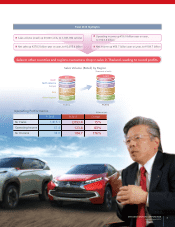
Fiscal 2013 Highlights
Sales volume (retail) up 60,000 units, to 1,047,000 vehicles
Net sales up ¥278.3 billion year on year, to ¥2,093.4 billion
Operating income up ¥56.0 billion year on year,
to ¥123.4 billion
Net income up ¥66.7 billion year on year, to ¥104.7 billion
Sales in other countries and regions overcame a drop in sales in Thailand, leading to record prots.
Ja
p
an
North America
Europe
Asia
(Thousands of units)
Sales Volume (Retail) by Region
FY2012
357
181
987
134
85
230
FY2013
202
261
1,047
143
97
344
Other Regions
Operating Performance
FY2012 FY2013 Change
Net Sales 1,815.1 2,093.4 15%
Operating Income 67.4 123.4 83%
Net Income 38.0 104.7 176%
(Billions of yen)
FY
20
12
FY
20
13
C
han
ge
Ne
t
Sale
s
1,
8
15.1
2
,
09
3.
4
15
%
Op
erat
i
ng Income
6
7
.4
12
3
.4
83
%
N
e
t
I
ncom
e
38
.
0
10
4
.
7
17
6%
MITSUBISHI MOTORS CORPORATION
Annual Report 2014 7