Mitsubishi 2014 Annual Report Download - page 18
Download and view the complete annual report
Please find page 18 of the 2014 Mitsubishi annual report below. You can navigate through the pages in the report by either clicking on the pages listed below, or by using the keyword search tool below to find specific information within the annual report.-
 1
1 -
2
-
3
-
4
-
5
-
6
-
7
-
 8
8 -
 9
9 -
 10
10 -
 11
11 -
 12
12 -
 13
13 -
 14
14 -
 15
15 -
 16
16 -
 17
17 -
 18
18 -
 19
19 -
 20
20 -
 21
21 -
 22
22 -
 23
23 -
 24
24 -
 25
25 -
 26
26 -
 27
27 -
 28
28 -
29
-
30
-
31
-
32
-
33
-
34
-
35
-
36
-
37
-
38
-
39
-
40
-
41
-
42
-
43
-
44
-
45
-
46
-
47
-
48
-
49
-
50
-
51
-
52
-
53
-
54
-
55
-
56
-
57
-
58
-
59
-
60
-
61
-
62
-
63
-
64
-
65
-
66
-
67
-
68
-
69
-
70
 |
 |

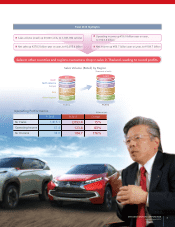
In scal 2013, although retail sales volume declined in
Thailand, retail sales volume in Japan, North America,
Europe, China and other ASEAN countries compensated,
leading to a year-on-year increase of 60,000 units, or 6%,
to 1,047,000 units. As a result, net sales expanded ¥278.3
billion, or 15%, to ¥2,093.4 billion. Due to the higher sales
volume and generally positive exchange rate movements
(excluding the negative impact of exchange with the Thai
baht), operating income surged ¥56.0 billion, or 83%, to
¥123.4 billion. Net income also soared ¥66.7 billion, or
176%, to ¥104.7 billion, marking a record high.
In scal 2014, we aim to augment sales volume, partic-
ularly in Asia, generating stronger sales and income.
Net Sales
(Billions of yen)
FY2012 FY2013 FY2014 (Forecast)
Japan 329.5 474.1 500.0
North America 157.7 229.4 220.0
Europe 400.7 484.3 550.0
Asia 501.7 415.7 540.0
Other Regions 425.5 489.9 490.0
Total 1,815.1 2,093.4 2,300.0
Operating Income (Loss)
(Billions of yen)
FY2012 FY2013 FY2014 (Forecast)
Japan (27.6) 0.9 3.0
North America (20.0) (3.8) 0.0
Europe (7.0) 37.2 48.0
Asia 93.6 59.8 57.0
Other Regions 28.4 29.3 27.0
Total 67.4 123.4 135.0
Sales Volume (Retail)
(Thousands of units)
FY2012 FY2013 FY2014 (Target)
Japan 134 143 147
North America 85 97 109
Europe 181 202 225
Asia 357 344 431
Other Regions 230 261 270
Total 987 1,047 1,182
2014
(Forecast)
20132012
0
500
1,000
1,500
2,000
2,500
157.7
(Billions of yen)
Japan North America Europe Asia Other Regions
540.0
490.0
550.0
220.0
500.0
484.3
415.7
489.9
229.4
474.1
2,093.4
2,300.0
425.5
501.7
400.7
329.5
1,815.1
2014
(Forecast)
20132012
Japan North America Europe Asia Other Regions
-75
0
75
150
(Billions of yen)
57.0
27.0
48.0
59.8
37.2
29.3
(3.8)
(7.0)
123.4
0.9 3.0
135.0
93.6
28.4
67.4
(27.6)
(20.0)
2014
(Target)
20132012
Japan North America Europe Asia Other Regions
0
300
600
900
1,200
(Thousands of units)
431
270
225
109
147
344
261
202
97
143
1,047
1,182
357
230
181
85
134
987
In scal 2014, we anticipate further rises in sales and
income thanks to higher sales volume, centered on Asia.
We expect to increase our retail sales volume in every
region, starting with a rise of 87,000 units in Asia, to
431,000 units. Overall, we forecast growth of 135,000
units, or 13%, to 1,182,000 units. Consequently, we expect
net sales to rise ¥206.6 billion, or 10%, compared with scal
2013, to ¥2,300.0 billion. We also forecast that operating
income will grow ¥11.6 billion, or 9%, to ¥135.0 billion,
and net income will expand ¥5.3 billion, or 5%, to ¥110.0
billion. As in scal 2013, we expect to hit new highs.
Overview of Operations by Region
MITSUBISHI MOTORS CORPORATION
Annual Report 2014
16