Lululemon 2015 Annual Report Download - page 37
Download and view the complete annual report
Please find page 37 of the 2015 Lululemon annual report below. You can navigate through the pages in the report by either clicking on the pages listed below, or by using the keyword search tool below to find specific information within the annual report.-
 1
1 -
2
-
3
-
4
-
5
-
6
-
7
-
8
-
9
-
10
-
11
-
12
-
13
-
14
-
15
-
16
-
17
-
18
-
19
-
20
-
21
-
22
-
23
-
24
-
25
-
26
-
 27
27 -
 28
28 -
 29
29 -
 30
30 -
 31
31 -
 32
32 -
 33
33 -
 34
34 -
 35
35 -
 36
36 -
 37
37 -
 38
38 -
 39
39 -
 40
40 -
 41
41 -
 42
42 -
 43
43 -
 44
44 -
 45
45 -
 46
46 -
 47
47 -
48
-
49
-
50
-
51
-
52
-
53
-
54
 |
 |

Table of Contents
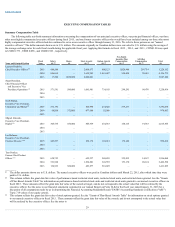
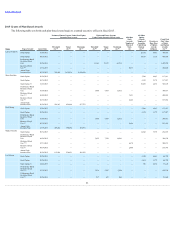
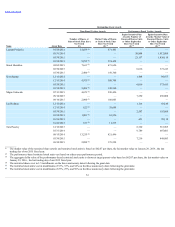
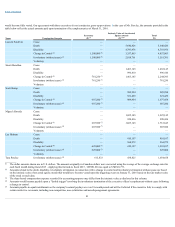
Outstanding Stock Awards
Time-Based Vesting Awards
Performance-Based Vesting Awards
Name
Grant Date
Number of Shares or
Units of Stock That Have
Not Vested
(#)
Market Value of Shares
or Units of Stock That
Have Not Vested
($) (1)
Equity Incentive Plan
Awards: Number of
Unearned Shares, Units
or Other Rights that
Have Not Vested
(#) (2)
Equity Incentive Plan
Awards: Market Value of
Unearned Shares, Units
or Other Rights that
Have Not Vested
($) (3)
Laurent Potdevin
01/20/2014
14,039 (4)
871,401
—
—
03/31/2014
—
—
30,804
1,912,004
03/30/2015
—
—
23,137
1,436,114
03/30/2015
9,255 (5)
574,458
—
—
Stuart Haselden
02/02/2015
7,631 (5)
473,656
—
—
03/30/2015
—
—
6,016
373,413
03/30/2015
2,406 (5)
149,340
—
—
Scott Stump
12/15/2014
—
—
1,448
89,877
12/15/2014
4,975 (5)
308,798
—
—
03/30/2015
—
—
6,016
373,413
03/30/2015
2,406 (5)
149,340
—
—
Miguel Almeida
07/13/2015
4,679 (5)
290,426
—
—
09/14/2015
—
—
7,250
450,008
09/14/2015
2,900 (5)
180,003
—
—
Lee Holman
12/15/2014
—
—
1,114
69,146
12/15/2014
622 (5)
38,608
—
—
03/30/2015
—
—
2,507
155,609
03/30/2015
1,003 (5)
62,256
—
—
10/26/2015
—
—
453
28,118
10/26/2015
181 (5)
11,235
—
—
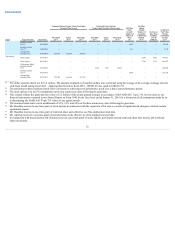
Tara Poseley
12/16/2013
—
—
8,360
518,905
03/31/2014
—
—
9,789
607,603
09/15/2014
13,235 (6)
821,496
—
—
03/30/2015
—
—
7,219
448,083
03/30/2015
2,888 (5)
179,258
—
—
_________
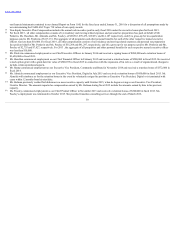
(1) The market value of the restricted share awards and restricted stock units is based on $62.07 per share, the fair market value on January 29, 2016 , the last
trading day of our 2015 fiscal year.
(2) The performance-based restricted stock units vest based on a three-year performance period.
(3) The aggregate dollar value of the performance-based restricted stock units is shown at target payout value based on $62.07 per share, the fair market value on
January 29, 2016 , the last trading day of our 2015 fiscal year.
(4) The restricted shares vest in 1/3 installments on the three anniversary dates following the grant date.
(5) The restricted stock units vest in installments of 33%, 33%, and 34% on the three anniversary dates following the grant date.
(6) The restricted stock units vest in installments of 25%, 25%, and 50% on the three anniversary dates following the grant date.
34