Hyundai 2010 Annual Report Download - page 78
Download and view the complete annual report
Please find page 78 of the 2010 Hyundai annual report below. You can navigate through the pages in the report by either clicking on the pages listed below, or by using the keyword search tool below to find specific information within the annual report.-
 1
1 -
2
-
3
-
4
-
5
-
6
-
7
-
8
-
9
-
10
-
11
-
12
-
13
-
14
-
15
-
16
-
17
-
18
-
19
-
20
-
21
-
22
-
23
-
24
-
25
-
26
-
27
-
28
-
29
-
30
-
31
-
32
-
33
-
34
-
35
-
36
-
37
-
38
-
39
-
40
-
41
-
42
-
43
-
44
-
45
-
46
-
47
-
48
-
49
-
50
-
51
-
52
-
53
-
54
-
55
-
56
-
57
-
58
-
59
-
60
-
61
-
62
-
63
-
64
-
65
-
66
-
67
-
 68
68 -
 69
69 -
 70
70 -
 71
71 -
 72
72 -
 73
73 -
 74
74 -
 75
75 -
 76
76 -
 77
77 -
 78
78 -
 79
79 -
 80
80 -
 81
81 -
 82
82 -
 83
83 -
 84
84
 |
 |

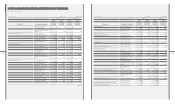
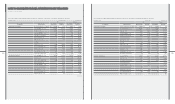
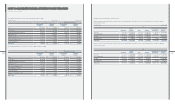
(2) Regional Results of Operations and Total Assets
Results of operations and total assets, by region where the Company and its subsidiaries for the year ended and as of December 31, 2010 are
located, are as follows:
₩
North Consolidation Consolidation
Domestic America Asia Europe adjustments amounts
Total sales ₩ 85,364,941 ₩ 35,378,735 ₩ 18,340,484 ₩ 26,875,151 ₩ (53,369,632) ₩ 112,589,679
Inter-company sales (29,818,151) (10,888,188) (1,663,975) (10,999,318) 53,369,632 -
Net sales 55,546,790 24,490,547 16,676,509 15,875,833 - 112,589,679
Operating income 6,769,687 919,820 936,185 147,251 344,799 9,117,742
Total assets 102,748,022 23,779,771 9,386,624 13,625,312 (31,461,911) 118,077,818
Results of operations and total assets, by region where the Company and its subsidiaries for the year ended and as of December 31, 2009 are
located, are as follows:
₩
North Consolidation Consolidation
Domestic America Asia Europe adjustments amounts
Total sales ₩ 69,233,672 ₩ 24,976,955 ₩ 15,389,963 ₩ 17,897,319 ₩ (36,034,845) ₩ 91,463,064
Inter-company sales (25,646,181) (4,528,234) (1,439,188) (4,421,242) 36,034,845 -
Net sales 43,587,491 20,448,721 13,950,775 13,476,077 - 91,463,064
Operating income 4,923,882 216,618 531,745 (886,613) 834,609 5,620,241
Total assets 88,219,897 19,311,188 8,230,392 13,072,414 (26,508,957) 102,324,934
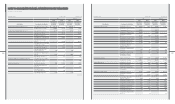
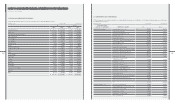
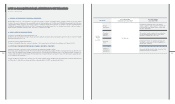
Consolidated Statements of Income for the year ended December 31, 2010
₩Translation into$ (Note 2)
Non-nancial Financial Non-nancial Financial
industry industry industry industry
Sales ₩ 106,791,359 ₩ 5,798,320 $ 93,767,108 $ 5,091,158
Cost of sales 82,887,331 3,172,630 72,778,410 2,785,697
Selling and administrative expenses 15,879,130 1,532,846 13,942,515 1,345,900
Operating income 8,024,898 1,092,844 7,046,183 959,561
Other income, net 1,218,312 116,064 1,069,727 101,909
Income before income tax 9,243,210 1,208,908 8,115,910 1,061,470
Income tax expense 2,214,192 255,002 1,944,150 223,902
Net income ₩ 7,029,018 ₩ 953,906 $ 6,171,760 $ 837,568
Consolidated Statements of Income for the year ended December 31, 2009
₩Translation into$ (Note 2)
Non-nancial Financial Non-nancial Financial
industry industry industry industry
Sales ₩ 86,421,828 ₩ 5,041,236 $ 75,881,840 $ 4,426,408
Cost of sales 68,187,590 2,867,486 59,871,446 2,517,768
Selling and administrative expenses 13,459,439 1,328,308 11,817,928 1,166,308
Operating income 4,774,799 845,442 4,192,466 742,332
Other income (expenses), net (91,191) 28,722 (80,070) 25,219
Income before income tax 4,683,608 874,164 4,112,396 767,551
Income tax expense 1,300,065 217,211 1,141,509 190,720
Changes in consolidation scope (2,487) 5,427 (2,184) 4,765
Net income ₩ 3,381,056 ₩ 662,380 $ 2,968,703 $ 581,596
[in millions of KRW]Hyundai Motor Company [in thousands of US$]
December 31, 2010 and 2009
Hyundai Motor Company [in millions of KRW]