Hyundai 2010 Annual Report Download - page 44
Download and view the complete annual report
Please find page 44 of the 2010 Hyundai annual report below. You can navigate through the pages in the report by either clicking on the pages listed below, or by using the keyword search tool below to find specific information within the annual report.-
 1
1 -
2
-
3
-
4
-
5
-
6
-
7
-
8
-
9
-
10
-
11
-
12
-
13
-
14
-
15
-
16
-
17
-
18
-
19
-
20
-
21
-
22
-
23
-
24
-
25
-
26
-
27
-
28
-
29
-
30
-
31
-
32
-
33
-
 34
34 -
 35
35 -
 36
36 -
 37
37 -
 38
38 -
 39
39 -
 40
40 -
 41
41 -
 42
42 -
 43
43 -
 44
44 -
 45
45 -
 46
46 -
 47
47 -
 48
48 -
 49
49 -
 50
50 -
 51
51 -
 52
52 -
 53
53 -
 54
54 -
55
-
56
-
57
-
58
-
59
-
60
-
61
-
62
-
63
-
64
-
65
-
66
-
67
-
68
-
69
-
70
-
71
-
72
-
73
-
74
-
75
-
76
-
77
-
78
-
79
-
80
-
81
-
82
-
83
-
84
 |
 |

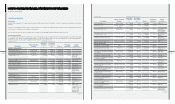
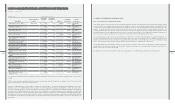
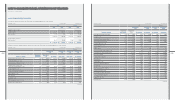
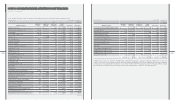
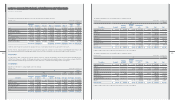
Earnings per Common Share
Basic earnings per common share are computed by dividing net income available to common shareholders by the weighted average number of common
shares outstanding during the period. Diluted earnings per common share are computed by dividing diluted net income, which is adjusted by adding back
the after-tax amount of expenses related to diluted securities, by weighted average number of common shares and diluted securities outstanding during the
period.
Basic earnings per common share for the year ended December 31, 2010 and 2009 are computed as follows:
₩$ (Note 2)
2010 2009 2010 2009
Net income attributable to equity holders of the parent ₩ 5,441,279 ₩ 2,973,473 $ 4,777,662 $ 2,610,829
Expected dividends on preferred stock (1,251,316) (682,777) (1,098,706) (599,506)
Net income available to common share 4,189,963 2,290,696 3,678,956 2,011,323
Weighted average number of common shares outstanding (*) 208,959,792 209,252,481 208,959,792 209,252,481
Basic earnings per common share ₩ 20,052 ₩ 10,947 $ 17.61 $ 9.61
(*) Weighted average number of common shares outstanding includes transactions pertaining to change of treasury stock.
The Company does not compute diluted earnings per common share for the years ended December 31, 2010 and 2009 because there is no item related to
dilution.
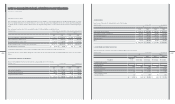
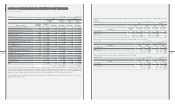
3. RESTRICTED FINANCIAL INSTRUMENTS :
Deposits with withdrawal restrictions as of December 31, 2010 and 2009 consist of the following:
₩$ (Note 2)
2010 2009 2010 2009
Cash and cash equivalents ₩ 366,073 ₩ 373,817 $ 321,427 $ 328,226
Short-term nancial instruments 205,804 139,539 180,704 122,521
Long-term nancial instruments 255 26,520 224 23,286
₩ 572,132 ₩ 539,876 $ 502,355 $ 474,033
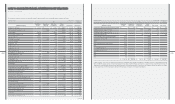
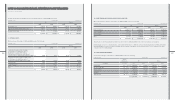
4. INVENTORIES:
Inventories as of December 31, 2010 and 2009 consist of the following:
₩$ (Note 2)
2010 2009 2010 2009
Finished goods and merchandise ₩ 6,429,178 ₩ 6,913,946 $ 5,645,077 $ 6,070,723
Semi nished goods and work in process 1,435,004 1,269,412 1,259,991 1,114,595
Raw materials and supplies 2,357,218 1,866,346 2,069,732 1,638,727
Materials in transit 588,538 639,987 516,760 561,934
Other 715,324 1,005,460 628,084 882,834
₩ 11,525,262 ₩ 11,695,151 $ 10,119,644 $ 10,268,813
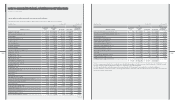
5. SHORT-TERM INVESTMENT SECURITIES:
Short-term investment securities as of December 31, 2010 and 2009 consist of the following:
₩ $ (Note 2)
2010 2009 2010 2009
Acquisition
Description cost Book value Book value Book value Book value
Available-for-sale securities:
Government bonds ₩ 6 ₩ 6 ₩ - $ 5 $ -
Corporate bonds 2,000 2,000 4,800 1,756 4,215
Beneciary certicates - - 163,526 - 143,582
Equity securities 183 130 82,577 114 72,506
Held-to-maturity securities:
Government bonds 744 744 1,699 654 1,492
₩ 2,933 ₩ 2,880 ₩ 252,602 $ 2,529 $ 221,795
[in millions except per share amounts of KRW]Hyundai Motor Company [in thousands except per share amounts of US$]
December 31, 2010 and 2009
[in millions of KRW]Hyundai Motor Company [in thousands of US$]
[in millions of KRW]Hyundai Motor Company [in thousands of US$]
[in millions of KRW]Hyundai Motor Company [in thousands of US$]