Hyundai 2010 Annual Report Download - page 7
Download and view the complete annual report
Please find page 7 of the 2010 Hyundai annual report below. You can navigate through the pages in the report by either clicking on the pages listed below, or by using the keyword search tool below to find specific information within the annual report.-
 1
1 -
 2
2 -
 3
3 -
 4
4 -
 5
5 -
 6
6 -
 7
7 -
 8
8 -
 9
9 -
 10
10 -
 11
11 -
 12
12 -
 13
13 -
 14
14 -
 15
15 -
 16
16 -
 17
17 -
 18
18 -
19
-
20
-
21
-
22
-
23
-
24
-
25
-
26
-
27
-
28
-
29
-
30
-
31
-
32
-
33
-
34
-
35
-
36
-
37
-
38
-
39
-
40
-
41
-
42
-
43
-
44
-
45
-
46
-
47
-
48
-
49
-
50
-
51
-
52
-
53
-
54
-
55
-
56
-
57
-
58
-
59
-
60
-
61
-
62
-
63
-
64
-
65
-
66
-
67
-
68
-
69
-
70
-
71
-
72
-
73
-
74
-
75
-
76
-
77
-
78
-
79
-
80
-
81
-
82
-
83
-
84
 |
 |

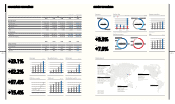
Revenue
Operating Income
Net Income
Total Asset
Average Sales Price
R&D
₩$
2007 2008 2009 2010 2010
FOR THE YEAR:
Net Revenue 69,601,516 79,736,351 91,463,064 112,589,679 98,858,266
Operating Income 2,848,022 3,072,043 5,620,241 9,117,742 8,005,744
Net Income 1,956,087 1,092,552 4,043,436 7,982,924 7,009,328
ROE 8.25% 4.31% 13.96% 21.73% 21.73%
AT YEAR END:
Total Asset 83,847,526 103,205,783 102,324,934 118,077,818 103,677,073
Shareholder’s Equity 23,713,636 25,351,897 28,961,660 36,735,601 32,255,335
2006 2007 2008 2009 2010
CREDIT RATING:
Korea Ratings AA AA AA AA AA+
S&P BBB- BBB- BBB- BBB- BBB
Moody’s Baa3 Baa3 Baa3 Baa3 Baa2
[in millions of KRW] [in thousands of US$]
[HMC only]
Revenues KRW (Billion)
2006 2007 2008 2009 2010
100,000
80,000
60,000
40,000
20,000
0
63,648
69,602
79,736
91,463
112,590
Operating income KRW (Billion)
2006 2007 2008 2009 2010
10,000
8,000
6,000
4,000
2,000
0
1,797
2,848
3,072
5,620
9,118
Total asset KRW (Billion)
2006 2007 2008 2009 2010
100,000
80,000
60,000
40,000
20,000
0
70,709
83,848
103,206
102,325
118,078
Net income KRW (Billion)
2006 2007 2008 2009 2010
10,000
8,000
6,000
4,000
2,000
0
1,311
1,956
1,093
4,043
7,983
Stockholders’ equity KRW (Billion)
2006 2007 2008 2009 2010
50,000
40,000
30,000
20,000
10,000
0
20,966
23,714
25,352
28,962
36,736
ROE (Return on equity) %
2006 2007 2008 2009 2010
25
20
15
10
5
0
6.25
8.25
4.31
13.96
21.73
Average sales price KRW (Thousand)
2006 2007 2008 2009 2010
25,000
20,000
15,000
10,000
5,000
0
14,114
14,280
15,686
17,718
18,300
R&D KRW (Billion)
2006 2007 2008 2009 2010
2,500
2,000
1,500
1,000
5,000
0
1,815
1,879
2,190
2,239
2,416
Revenues %
112,589
KRW (Billion)
5%
Financial
Service
95%
Automotives
Vehicle sales
2,500
2,000
1,500
1,000
500
0Korea
483658
North
America
410657
Europe
392474
Other
Regions
8031,912
KRW (Billion)Units (Thousand)
Hyundai KIA
5,789,008
Units
46.8%
Other
Regions
19.8%
Korea
18.5%
North
America
14.9%
Europe
Vehicle production %
2,138,802
KIA Units
10.73%
Slovakia
66.24%
Korea
Turkey 2.12%
3,626,151
Hyundai Units
Czech 5.52%
16.56%
India
15.84%
China
7.19%
US
19.43%
China
48.08%
Korea
8.29%
US
* Local sales of Hyundai & Kia Motors: excluding CKD sales * Domestic plant sales
Asia Pacific
Hyundai Motor Group China (HMGC)
Beijing Hyundai Motor Company (BHMC)
Hyundai Motor Japan (HMJ)
Hyundai Motor India (HMI)
Hyundai Motor Company Australia (HMCA)
Dongfeng Yueda Kia (DYK)
Kia Motors Australia (KMAI)
Kia Motors New Zealand (KMNZ)
North America
Hyundai Motor America (HMA)
Hyundai Motor Manufacturing Alabama (HMMA)
Hyundai Translead (HT)
Hyundai de Mexico (HYMEX)
Hyundai Auto Canada (HAC)
Kia Motors America (KMA)
Kia Motors Manufacturing Georgia (KMMG)
Kia Canada Inc. (KCI)
South America
Hyundai Motor Brazil (HMB)
W.Europe
Hyundai Motor United Kingdom. Ltd. (HMUK)
Hyundai Motor Norway AS (HMN)
Hyundai Motor Company Italy (HMCI)
Hyundai Motor Europe (HME)
Kia Motors Sweden (KMSW)
Kia Motors UK (KMUK)
Kia Motors Belgium (KMB)
Kia Motors Ireland (KMIE)
Kia Motors France (KMF)
Kia Motors Iberia (KMIB)
Kia Motors Central Europe(Austria) (KMAS)
Kia Motors Deutschland (KMD)
Kia Motors Europe(Deutschland) (KME)
E.Europe
Hyundai Motor Manufacturing Rus LLC (HMMR)
Hyundai Motor CIS (HMCIS)
Hyundai Motor Poland (HMP)
Hyundai Motor Czech s.r.o. (HMCZ)
Hyundai Motor Manufacturing Czech s.r.o. (HMMC)
Hyundai Assan Otomotive Sanayi Ve Ticaret (HAOS)
Kia Motors Slovakia (KMS)
Kia Motors Russia (KMR)
Kia Motors Polska (KMP)
HMC Production Plants
HMC Sales Subsidiaries
KMC Production Plants
KMC Sales Subsidiaries
Global network