Hyundai 2010 Annual Report Download - page 73
Download and view the complete annual report
Please find page 73 of the 2010 Hyundai annual report below. You can navigate through the pages in the report by either clicking on the pages listed below, or by using the keyword search tool below to find specific information within the annual report.-
 1
1 -
2
-
3
-
4
-
5
-
6
-
7
-
8
-
9
-
10
-
11
-
12
-
13
-
14
-
15
-
16
-
17
-
18
-
19
-
20
-
21
-
22
-
23
-
24
-
25
-
26
-
27
-
28
-
29
-
30
-
31
-
32
-
33
-
34
-
35
-
36
-
37
-
38
-
39
-
40
-
41
-
42
-
43
-
44
-
45
-
46
-
47
-
48
-
49
-
50
-
51
-
52
-
53
-
54
-
55
-
56
-
57
-
58
-
59
-
60
-
61
-
62
-
 63
63 -
 64
64 -
 65
65 -
 66
66 -
 67
67 -
 68
68 -
 69
69 -
 70
70 -
 71
71 -
 72
72 -
 73
73 -
 74
74 -
 75
75 -
 76
76 -
 77
77 -
 78
78 -
 79
79 -
 80
80 -
 81
81 -
 82
82 -
 83
83 -
84
 |
 |

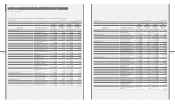
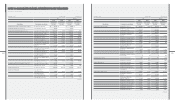
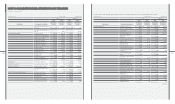
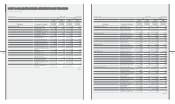
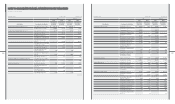
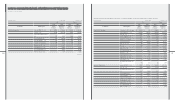
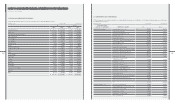
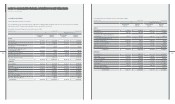
27. SELLING AND ADMINISTRATIVE EXPENSES:
Selling and administrative expenses for the year ended December 31, 2010 and 2009 are as follows:
₩$ (Note 2)
2010 2009 2010 2009
Salary-related costs ₩ 3,653,217 ₩ 3,282,206 $ 3,207,671 $2,881,909
Export costs 1,733,841 1,261,844 1,522,382 1,107,950
Sales promotion and advertisements 4,690,035 3,781,283 4,118,039 3,320,119
Sales commissions 680,182 932,110 597,227 818,430
Sales warranties 2,036,673 1,239,006 1,788,281 1,087,897
Taxes and dues 119,351 274,774 104,795 241,263
Communications 57,759 57,896 50,715 50,835
Utilities 86,925 90,821 76,324 79,744
Freight and warehousing 853,732 754,111 749,611 $662,140
Rent 142,925 145,437 125,494 127,700
Travel 230,941 175,967 202,775 154,506
Service charges 660,282 732,154 579,754 642,861
Maintenance 102,152 98,479 89,694 86,469
Supplies 57,350 33,418 50,356 29,342
Research 952,324 663,384 836,179 582,478
Depreciation 469,767 516,004 412,474 453,072
Amortization 88,488 110,703 77,696 97,202
Provision for other liabilities 40,984 55,510 35,986 48,740
Bad debt 326,870 320,434 287,005 281,354
Other 428,178 262,206 375,957 230,225
₩ 17,411,976 ₩ 14,787,747 $ 15,288,415 $12,984,236
[in millions of KRW]Hyundai Motor Company [in thousands of US$]
December 31, 2010 and 2009
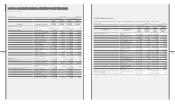
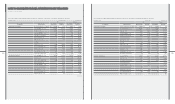
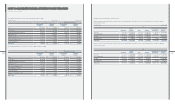
28. COMMITMENTS AND CONTINGENCIES:
(1) The Company and its consolidated subsidiaries are contingently liable for guarantees of indebtedness of related parties including subsidiaries as of December
31, 2010, details are as follows:
Company providing
guarantee of indebtedness Beneciary companies ₩ $ (Note 2)
Hyundai Motor Company Hyundai Capital Services, Inc. ₩ 643,192 $ 564,748
Hyundai Rotem Company 304,225 267,122
Hyundai Merchant Marine Co., Ltd. 181,907 159,722
Hyundai Card Co., Ltd . 93,390 82,000
Hyundai Motor America 250,558 220,000
Hyundai Motor Manufacturing Alabama, LLC 427,088 375,000
Hyundai Capital America 1,789,253 1,571,036
Hyundai Motor India 256,253 225,000
Hyundai Motor Europe GmbH 46,517 40,844
Hyundai Motor Europe Technical Center GmbH 75,680 66,450
Hyundai Motor Manufacturing Rus LLC 409,277 359,362
Hyundai Motor Manufacturing Czech, s.r.o. 1,245,585 1,093,674
Hyundai Motor UK Limited. 35,154 30,867
Hyundai Motor Commonwealth
of Independent States 52,976 46,515
Hyundai Motor Japan Co. 27,942 24,534
Hyundai Motor Espana, S.L.U. 75,680 66,450
Hyundai Motor Company Italy S.r.l. 113,520 99,675
Hyundia Motor Japan R&D Center Inc. 7,684 6,747
Hyundai Motor Poland Sp.Zo.O 15,136 13,290
Hyundai Translead, Inc. 87,695 77,000
Stampted Metal America Research Technology Inc.
136,668 120,000
Hyundai America Technical Center, Inc. 22,778 20,000
Beijing Jingxian Motor Safeguard Service Co., Ltd.
8,177 7,180
UTS 273,336 240,000
Hyundai HYSCO Co., Ltd. Hysco America Company, Inc. 119,585 105,000
Beijing Hyundai Hysco Steel Process Co., Ltd. 91,279 80,147
Hyundai Hysco Czech S.R.O 68,112 59,805
Hyundai Hysco USA, Inc. 56,945 50,000
Hyundai Hysco Slovakia S.R.O 54,868 48,176
Hysco Steel India. Ltd 45,556 40,000
(continued)
[in millions of KRW]Hyundai Motor Company [in thousands of US$]