Hyundai 2010 Annual Report Download - page 50
Download and view the complete annual report
Please find page 50 of the 2010 Hyundai annual report below. You can navigate through the pages in the report by either clicking on the pages listed below, or by using the keyword search tool below to find specific information within the annual report.-
 1
1 -
2
-
3
-
4
-
5
-
6
-
7
-
8
-
9
-
10
-
11
-
12
-
13
-
14
-
15
-
16
-
17
-
18
-
19
-
20
-
21
-
22
-
23
-
24
-
25
-
26
-
27
-
28
-
29
-
30
-
31
-
32
-
33
-
34
-
35
-
36
-
37
-
38
-
39
-
 40
40 -
 41
41 -
 42
42 -
 43
43 -
 44
44 -
 45
45 -
 46
46 -
 47
47 -
 48
48 -
 49
49 -
 50
50 -
 51
51 -
 52
52 -
 53
53 -
 54
54 -
 55
55 -
 56
56 -
 57
57 -
 58
58 -
 59
59 -
 60
60 -
61
-
62
-
63
-
64
-
65
-
66
-
67
-
68
-
69
-
70
-
71
-
72
-
73
-
74
-
75
-
76
-
77
-
78
-
79
-
80
-
81
-
82
-
83
-
84
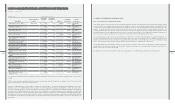
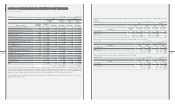
 |
 |

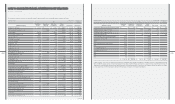
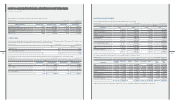
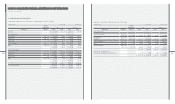
₩ $ (Note 2)
Beginning Acquisition Gain (loss) Other
Afliated company of year (disposal) on valuation changes (*) End of year End of year
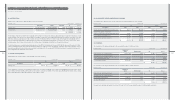
Hyundai Motor Brasil Montadora de Automoveis LTDA ₩ - ₩ 137 ₩ - ₩ - ₩ 137 $ 120
EUKOR Shipowning Singapore Pte Ltd. - 8 9,895 (7,362) 2,541 2,232
EUKOR Car Carriers Singapore Pte Ltd. 5 - - - 5 4
Hyundai Rotem Automotive 86 - 44 (6) 124 109
Hyundai WIA Motor Dies (Shandong) Company 14,681 - - (14,681) - -
Hyundai Hysco Czech S.R.O 14,329 - - (14,329) - -
HECT 5,277 - - (5,277) - -
Dymos India Automotive Private Limited 4,873 - - (4,873) - -
HAIL 4,308 - - (4,308) - -
Seoul Sung Bo Chiup LLC 4,237 - - (4,237) - -
Morningstar Korea Co., Ltd. 2,673 - - (2,673) - -
HAE 1,005 - - (1,005) - -
HAIE 925 - - (925) - -
HAA 450 - - (450) - -
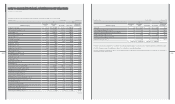
₩ 2,702,336 ₩ 128,139 ₩ 914,103 ₩ 151,117 ₩ 3,895,695 $ 3,420,577
(*) Other changes consist of the decrease by ₩125,132 million (US$109,871 thousand) due to declaration of dividends, increase of capital surplus by ₩516
million (US$453 thousand), increase of retained earnings by ₩ 7,720 million (US$6,778 thousand), increase of accumulated other comprehensive income by ₩
118,924 million (US$104,420 thousand), decrease by ₩2,015 million (US$1,769 thousand) due to decrease in ownership percentage caused by uneven capital
increase and increase of ₩151,104 million (US$132,675 thousand) due to changes of consolidated subsidiaries.
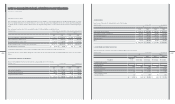
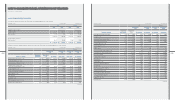
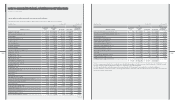
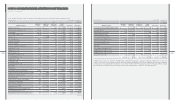
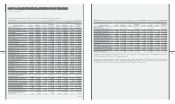
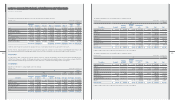
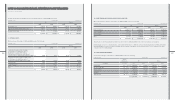
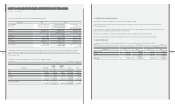
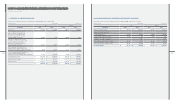
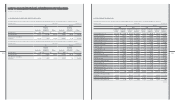
The changes in investment securities accounted for using the equity method for the year ended December 31,2010 are as follows:
₩ $ (Note 2)
Beginning Acquisition Gain (loss) Other
Afliated company of year (disposal) on valuation changes (*) End of year End of year
Hyundai Steel Company ₩ 791,420 ₩ - ₩ 239,377 ₩ 100,677 ₩ 1,131,474 $ 993,480
HMC Investment Securities Co., Ltd. - 72,448 500 142,346 215,294 189,037
Hyundai MOBIS 594,126 - 297,882 140,136 1,032,144 906,264
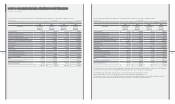
Korea Aerospace Industries, Ltd 93,452 - 9,698 - 103,150 90,570
Eukor Car Carriers Inc. 100,623 - 9,390 (5,126) 104,887 92,095
HK Mutual Savings Bank 26,391 8,605 (1,600) 2,403 35,799 31,433
Korea Economy Daily 32,133 - 2,011 (326) 33,818 29,694
Kia Tigers Co., Ltd. 31 - (31) - - -
Donghui Auto Co., Ltd. 9,607 - 1,196 - 10,803 9,485
Hyundai Amco Co., Ltd. 73,161 - 12,659 (4,284) 81,536 71,592
TRW Steering Co., Ltd. 6,369 - 162 - 6,531 5,734
WIA-MAGNA Power Train Co.,Ltd. - 7,500 (851) - 6,649 5,838
Korea Credit Bureau Co., Ltd. 3,205 - (14) - 3,191 2,802
Hyundai Wisco Co., Ltd. 23,360 - 3,114 (99) 26,375 23,158
Iljin Bearing Co., Ltd. 16,843 - 1,583 (225) 18,201 15,981
Daesung Automotive Co., Ltd. 11,323 - 1,680 191 13,194 11,585
MAINTRANCE 573 - 197 - 770 676
Beijing-Hyundai Motor Company (BHMC) 825,829 19,405 311,254 (156,795) 999,693 877,771
Hyundai Motor Deutschland GmbH (HMDG) 22,715 4,767 13,035 (2,617) 37,900 33,278
KEFICO Vietnam Company Limited - 6,245 (73) (331) 5,841 5,129
Hyundai Motor Hungary (HMH) 2,283 - - - 2,283 2,005
Autoever Systems America, Inc. - 4,642 456 (476) 4,622 4,058
KEFICO Automotive Systems (Beijing) Co., Ltd. 595 3,317 (1,692) (647) 1,573 1,381
Beijing Lear Dymos Automotive Systems Co., Ltd. 7,195 - 3,582 (3,112) 7,665 6,730
Yan Ji Kia Motors A/S 1,792 - - - 1,792 1,573
Hyundai Capital Germany GmbH - 1,065 - - 1,065 935
Hyundai Motor Japan R&D Center Inc. 3,296 - (44) (307) 2,945 2,586
Autoever Systems China Co., Ltd. 1,026 - 106 (92) 1,040 913
Autoever Systems India Pvt. Ltd. 1,089 - 239 (59) 1,269 1,114
South Link9 712 - 469 - 1,181 1,037
Rotem Equipments (Beijing) Co., Ltd. 338 - (121) (14) 203 178
[in millions of KRW]Hyundai Motor Company [in thousands of US$]
(continued)
[in millions of KRW]Hyundai Motor Company [in thousands of US$]
December 31, 2010 and 2009