Hyundai 2010 Annual Report Download - page 59
Download and view the complete annual report
Please find page 59 of the 2010 Hyundai annual report below. You can navigate through the pages in the report by either clicking on the pages listed below, or by using the keyword search tool below to find specific information within the annual report.-
 1
1 -
2
-
3
-
4
-
5
-
6
-
7
-
8
-
9
-
10
-
11
-
12
-
13
-
14
-
15
-
16
-
17
-
18
-
19
-
20
-
21
-
22
-
23
-
24
-
25
-
26
-
27
-
28
-
29
-
30
-
31
-
32
-
33
-
34
-
35
-
36
-
37
-
38
-
39
-
40
-
41
-
42
-
43
-
44
-
45
-
46
-
47
-
48
-
 49
49 -
 50
50 -
 51
51 -
 52
52 -
 53
53 -
 54
54 -
 55
55 -
 56
56 -
 57
57 -
 58
58 -
 59
59 -
 60
60 -
 61
61 -
 62
62 -
 63
63 -
 64
64 -
 65
65 -
 66
66 -
 67
67 -
 68
68 -
 69
69 -
70
-
71
-
72
-
73
-
74
-
75
-
76
-
77
-
78
-
79
-
80
-
81
-
82
-
83
-
84
 |
 |

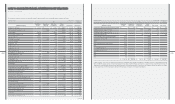
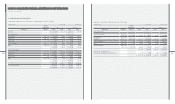
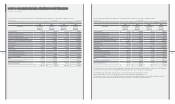
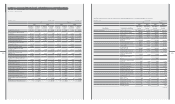
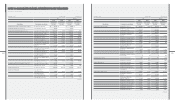
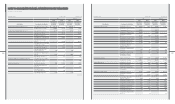
22. ACCUMULATED OTHER COMPREHENSIVE INCOME:
Accumulated other comprehensive income as of December 31, 2010 and 2009 consists of the following:
₩$ (Note 2)
Description 2010 2009 2010 2009
Gain on valuation of available-for-sale securities, net ₩ 881,531 ₩ 361,445 $ 774,020 $ 317,363
Gain (loss) on valuation of investment
securities accounted for using the equity method, net (8,904) 56,620 (7,818) 49,715
Loss on valuation of derivatives, net (12,398) (85,241) (10,886) (74,845)
Gain on overseas operation translation 130,977 173,146 115,003 152,029
₩ 991,206 ₩ 505,970 $ 870,319 $ 444,262
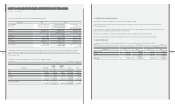
23. DIVIDENDS:
The computation of the proposed dividends for the year ended December 31, 2010 is as follows:
Number of
shares Dividend rate ₩ $ (Note 2)
Common shares, net of treasury shares 209,271,449 30% ₩ 313,907 $ 275,623
Preferred shares, net of treasury shares:
First and Third preferred shares 25,637,321 31% 39,738 34,892
Second preferred shares 36,613,865 32% 58,582 51,437
₩ 412,227 $ 361,952
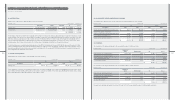
The computation of the proposed dividends for the year ended December 31, 2009 is as follows:
Number of
shares Dividend rate ₩ $ (Note 2)
Common shares, net of treasury shares 209,275,129 23% ₩ 240,666 $ 211,314
Preferred shares, net of treasury shares:
First and Third preferred shares 25,637,321 24% 30,766 27,014
Second preferred shares 36,613,865 25% 45,767 40,185
₩ 317,199 $ 278,513
The payout ratios (dividends declared/net income) are 7.6% and 10.7% for the years ended December 31, 2010 and 2009, respectively.
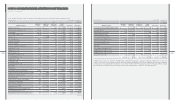
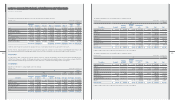
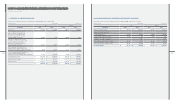
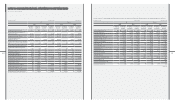
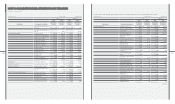
20. CAPITAL STOCK:
Capital stock as of December 31, 2010 and 2009 consists of the following:
Authorized Issued Par value ₩ $ (Note 2)
Common stock 450,000,000 shares 220,276,479 shares ₩ 5,000 ₩ 1,157,982 $ 1,016,755
Preferred stock 150,000,000 shares 65,202,146 shares 5,000 331,011 290,641
₩ 1,488,993 $ 1,307,396
The Company completed stock retirement of 1,320,000 common shares of treasury stock on May 4, 2004, which had been acquired for the purpose of such
retirement based on the decision of the Board of Directors on March 12, 2004. Also, the Company acquired treasury stock after the cancellation of the Trust
Cash Fund on March 2, 2001, and in accordance with the decision of the Board of Directors, on March 5, 2001, the Company retired 10,000,000 common
shares in treasury and 1,000,000 second preferred shares in treasury, which had additional dividend rate of 2 percent to the rate of common stock, using
retained earnings. Due to these stock retirements, the total face value of outstanding stock differs from the capital stock amount.
The preferred shares are non-cumulative, participating and non-voting. Of the total preferred stock issued of 65,202,146 shares as of December 31, 2010,
a total of 27,588,281 preferred shares (First and Third preferred shares) are eligible to receive cash dividends, if declared, equal to that declared for common
shares plus an additional 1 percent minimum increase while the dividend rate for the remaining 37,613,865 preferred shares (Second preferred shares) is 2
percent higher than that declared for common shares.
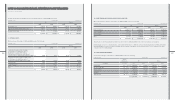
21. CAPITAL ADJUSTMENTS:
Capital adjustments as of December 31, 2010 and 2009 consist of the following:
₩$ (Note 2)
Description 2010 2009 2010 2009
Treasury stock ₩ 918,214 ₩ 743,909 $ 806,229 $ 653,182
For the stabilization of stock price, the Company has treasury stock consisting of 11,005,030 common shares and 2,950,960 preferred shares with a carrying
value of ₩918,214 million (US$806,229 thousand) as of December 31, 2010 and 11,213,999 common shares and 2,950,960 preferred shares with a carrying
value of ₩743,909 million (US$653,182 thousand) as of December 31, 2009.
[in millions of KRW]Hyundai Motor Company [in thousands of US$]
[in millions of KRW]Hyundai Motor Company [in thousands of US$]
[in millions of KRW]Hyundai Motor Company [in thousands of US$]
[in millions of KRW]Hyundai Motor Company [in thousands of US$]
December 31, 2010 and 2009
[in millions of KRW]Hyundai Motor Company [in thousands of US$]