Hyundai 2003 Annual Report Download - page 54
Download and view the complete annual report
Please find page 54 of the 2003 Hyundai annual report below. You can navigate through the pages in the report by either clicking on the pages listed below, or by using the keyword search tool below to find specific information within the annual report.-
 1
1 -
2
-
3
-
4
-
5
-
6
-
7
-
8
-
9
-
10
-
11
-
12
-
13
-
14
-
15
-
16
-
17
-
18
-
19
-
20
-
21
-
22
-
23
-
24
-
25
-
26
-
27
-
28
-
29
-
30
-
31
-
32
-
33
-
34
-
35
-
36
-
37
-
38
-
39
-
40
-
41
-
42
-
43
-
 44
44 -
 45
45 -
 46
46 -
 47
47 -
 48
48 -
 49
49 -
 50
50 -
 51
51 -
 52
52 -
 53
53 -
 54
54 -
 55
55 -
 56
56 -
 57
57 -
 58
58
 |
 |

Hyundai Motor Company Annual Report 2003 _106105_Hyundai Motor Company Annual Report 2003
HYUNDAI MOTOR COMPANY AND SUBSIDIARIES HYUNDAI MOTOR COMPANY AND SUBSIDIARIES
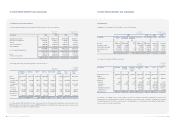
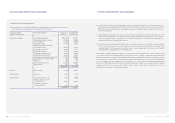
Consolidated Statement of Income for the year ended December 31, 2003
Non-financial Financial Non-financial Financial
industry industry industry industry
Sales 54,999,044 2,264,339 $45,916,717 $1,890,415
Cost of sales 42,495,126 878,383 35,477,647 733,330
Selling and administrative expenses 8,948,206 2,173,053 7,470,534 1,814,204
Operating income 3,555,712 (787,097) 2,968,536 (657,119)
Other expenses, net (16,098) (69,257) (13,440) (57,820)
Ordinary income 3,539,614 (856,354) 2,955,096 (714,939)
Extraordinary items, net - - - -
Income before income tax 3,539,614 (856,354) 2,955,096 (714,939)
Income tax expense 531,052 (66,316) 443,356 (55,365)
Income before minority interests 3,008,562 (790,038) 2,511,740 (659,574)
Minority interests 476,462 - 397,781 -
Net income 2,532,100 (790,038) $2,113,959 $(659,574)
Korean won
(in millions)
U. S. dollars (Note 2)
(in thousands)
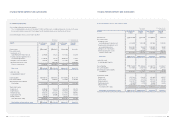
Consolidated Statement of Income for the year ended December 31, 2002
Non-financial Financial Non-financial Financial
industry industry industry industry
Sales 46,461,645 1,678,629 $38,789,151 $1,401,427
Cost of sales 34,937,000 1,089,731 29,167,641 909,777
Selling and administrative expenses 8,605,494 380,996 7,184,416 318,080
Operating income 2,919,151 207,902 2,437,094 173,570
Other expenses, net 284,157 20,784 237,232 17,352
Ordinary income 2,634,994 187,118 2,199,862 156,218
Extraordinary items, net - - - -
Income before income tax 2,634,994 187,118 2,199,862 156,218
Income tax expense 796,065 57,413 664,606 47,932
Income before minority interests 1,838,929 129,705 1,535,256 108,286
Minority interests 456,792 - 381,359 -
Net income 1,382,137 129,705 $1,153,897 $108,286
The above figures are not tally with the consolidated balance sheets and statements of income because the transactions
between non-financial and financial companies were not eliminated.
Korean won
(in millions)
U. S. dollars (Note 2)
(in thousands)
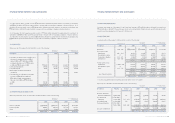
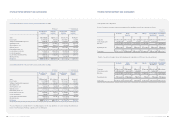
Domestic North Asia Europe Consolidation Consolidated
America adjustments amounts
Total sales 45,546,451 13,376,443 1,714,070 4,398,121 (18,446,675) 46,588,410
Intercompany sales (17,954,166) (54,932) (3,148) (434,429) 18,446,675 -
Net sales 27,592,285 13,321,511 1,710,922 3,963,692 - 46,588,410
Operating income 2,654,952 25,069 148,442 (13,293) (120,727) 2,694,443
Total assets 52,722,751 6,301,869 1,184,506 1,209,251 (7,165,700) 54,252,677
Results of operations, by region where the Company and its subsidiaries in 2002 are located, are as follows:
(2) Regional Results of Operations
Results of operations, by region where the Company and its subsidiaries in 2003 are located, are as follows:
Korean won
(in millions)
Domestic North Asia Europe Consolidation Consolidated
America adjustments amounts
Total sales 44,953,294 8,786,610 846,618 888,230 (11,055,126) 44,419,626
Intercompany sales (10,367,452) (663,818) (23,856) - 11,056,126 -
Net sales 34,585,842 8,122,792 822,762 888,230 - 44,419,626
Operating income 2,789,221 261,068 34,612 7,647 38,294 3,130,842
Total assets 46,663,159 3,556,458 609,081 366,032 (5,069,042) 46,125,688
Korean won
(in millions)