Hyundai 2003 Annual Report Download - page 28
Download and view the complete annual report
Please find page 28 of the 2003 Hyundai annual report below. You can navigate through the pages in the report by either clicking on the pages listed below, or by using the keyword search tool below to find specific information within the annual report.-
 1
1 -
2
-
3
-
4
-
5
-
6
-
7
-
8
-
9
-
10
-
11
-
12
-
13
-
14
-
15
-
16
-
17
-
 18
18 -
 19
19 -
 20
20 -
 21
21 -
 22
22 -
 23
23 -
 24
24 -
 25
25 -
 26
26 -
 27
27 -
 28
28 -
 29
29 -
 30
30 -
 31
31 -
 32
32 -
 33
33 -
 34
34 -
 35
35 -
 36
36 -
 37
37 -
 38
38 -
39
-
40
-
41
-
42
-
43
-
44
-
45
-
46
-
47
-
48
-
49
-
50
-
51
-
52
-
53
-
54
-
55
-
56
-
57
-
58
 |
 |

Hyundai Motor Company Annual Report 2003 _5453_Hyundai Motor Company Annual Report 2003
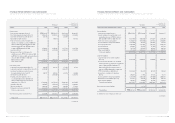
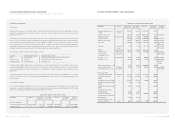
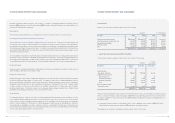
HYUNDAI MOTOR COMPANY AND SUBSIDIARIES
CONSOLIDATED BALANCE SHEETS (CONTINUED) AS OF DECEMBER 31, 2003 AND 2002
LIABILITIES AND SHAREHOLDERS’ EQUITY 2003 2002 2003 2002
Shareholders’ equity:
Capital stock (Note 15) 1,478,603 1,476,454 $1,234,432 $1,232,638
Capital surplus 5,328,775 5,286,061 4,448,802 4,413,142
Retained earnings
(Net income of 1,775,481 million in 2003
and 1,434,395 million in 2002) 5,147,775 3,677,983 4,297,692 3,070,615
Capital adjustments (Note 16) 380,692 (106,417) 317,826 (88,843)
Minority interests 3,918,857 3,104,001 3,271,712 2,591,418
Total shareholders’ equity 16,254,702 13,438,082 13,570,464 11,218,970
Total liabilities and shareholders’ equity 54,252,677 46,125,688 $45,293,602 $38,508,673
See accompanying notes to consolidated financial statements.
Korean won
(in millions)
Translation into
U. S. dollars (Note 2)
(in thousands)
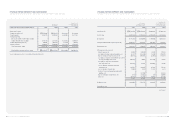
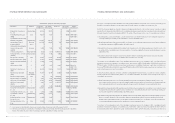
HYUNDAI MOTOR COMPANY AND SUBSIDIARIES
CONSOLIDATED STATEMENTS OF INCOME FOR THE YEARS ENDED DECEMBER 31, 2003 AND 2002
2003 2002 2003 2002
Sales (Note 25) 46,588,410 44,419,626 $38,894,982 $37,084,343
Cost of sales 32,801,126 31,759,528 27,384,476 26,514,884
Gross profit 13,787,284 12,660,098 11,510,506 10,569,459
Selling and administrative expenses (Note 18) 11,092,841 9,529,256 9,261,013 7,955,632
Operating income 2,694,443 3,130,842 2,249,493 2,613,827
Other expenses (income), net:
Interest expense, net 47,804 210,619 39,910 175,838
Loss (gain) on foreign currency translation, net 65,155 (132,258) 54,396 (110,417)
Gain on foreign currency transactions, net (26,877) (209,587) (22,439) (174,977)
Loss (gain) on valuation of investments accounted
for using the equity method, net (169,161) 70,065 (141,226) 58,495
Loss (gain) on disposal of investments
and other assets, net (127,567) 63,971 (106,501) 53,407
Loss on disposal of property, plant and
equipment, net 269,723 206,424 225,182 172,336
Loss on valuation of inventories 15,002 5,331 12,525 4,451
Provision for accrued warranties and product
liabilities, net - 291,708 - 243,536
Gain on redemption of debentures, net (115) (37,022) (96) (30,908)
Other, net (48,569) (81,206) (40,549) (67,796)
25,395 388,045 21,202 323,965
Ordinary income 2,669,048 2,742,797 2,228,291 2,289,862
Extraordinary item - - - -
(continued)
Korean won
(in millions, except
per share amounts)
Translation into
U. S. dollars (Note 2)
(in thousands, except
per share amounts)