Hyundai 2003 Annual Report Download - page 5
Download and view the complete annual report
Please find page 5 of the 2003 Hyundai annual report below. You can navigate through the pages in the report by either clicking on the pages listed below, or by using the keyword search tool below to find specific information within the annual report.-
 1
1 -
 2
2 -
 3
3 -
 4
4 -
 5
5 -
 6
6 -
 7
7 -
 8
8 -
 9
9 -
 10
10 -
 11
11 -
 12
12 -
 13
13 -
 14
14 -
 15
15 -
 16
16 -
17
-
18
-
19
-
20
-
21
-
22
-
23
-
24
-
25
-
26
-
27
-
28
-
29
-
30
-
31
-
32
-
33
-
34
-
35
-
36
-
37
-
38
-
39
-
40
-
41
-
42
-
43
-
44
-
45
-
46
-
47
-
48
-
49
-
50
-
51
-
52
-
53
-
54
-
55
-
56
-
57
-
58
 |
 |

Hyundai Motor Company Annual Report 2003 _ 010
Table of Contents
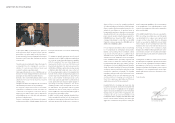
Letter from the Chairman _ 09
Letter from the Vice Chairman _ 11
History of Hyundai Motor Company _ 15
Hyundai Brands _ 19
Sports Marketing _ 29
Future Brands _ 39
Sustainable Management _ 43
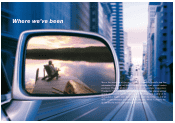
Global Report _ 45
Financial Statements _ 47
Full Line up _ 111
Corporate Information _ 113
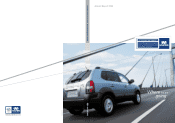
’o3Hyundai Motor Company
Annual Report
2003 Financial Highlights
Sales
(Korean Won in billions,
US dollars in millions)
Net Income
(Korean Won in billions,
US dollars in millions)
Total Assets
(Korean Won in billions,
US dollars in millions)
Shareholders’ Equity
(Korean Won in billions,
US dollars in millions)
Earnings Per Share
(Korean Won in billions,
US dollars in millions)
Dividends Per Share
(Korean Won in billions,
US dollars in millions)
2003 2002 2001 2003
Sales 46,588 44,420 39,852 $38,895
Net Income 1,775 1,434 1,152 1,482
Total Assets 54,252 46,126 39,872 45,294
Shareholders’ Equity 16,255 13,438 11,704 13,570
Earnings Per Share ( US $) 7,845 6,313 5,103 6.55
Dividends Per Share ( US $) 1,000 850 750 0.835
For the years ended December 31, 2003, 2002, and 2001
Korean won
in billions
US dollars
in millions