Hyundai 2003 Annual Report Download - page 39
Download and view the complete annual report
Please find page 39 of the 2003 Hyundai annual report below. You can navigate through the pages in the report by either clicking on the pages listed below, or by using the keyword search tool below to find specific information within the annual report.-
 1
1 -
2
-
3
-
4
-
5
-
6
-
7
-
8
-
9
-
10
-
11
-
12
-
13
-
14
-
15
-
16
-
17
-
18
-
19
-
20
-
21
-
22
-
23
-
24
-
25
-
26
-
27
-
28
-
 29
29 -
 30
30 -
 31
31 -
 32
32 -
 33
33 -
 34
34 -
 35
35 -
 36
36 -
 37
37 -
 38
38 -
 39
39 -
 40
40 -
 41
41 -
 42
42 -
 43
43 -
 44
44 -
 45
45 -
 46
46 -
 47
47 -
 48
48 -
 49
49 -
50
-
51
-
52
-
53
-
54
-
55
-
56
-
57
-
58
 |
 |

Hyundai Motor Company Annual Report 2003 _7675_Hyundai Motor Company Annual Report 2003
HYUNDAI MOTOR COMPANY AND SUBSIDIARIES HYUNDAI MOTOR COMPANY AND SUBSIDIARIES
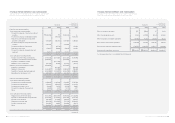
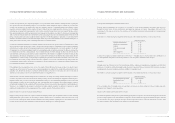
The difference of 1,063,735 million (US$888,074 thousand) as of December 31, 2003, between the book value and the
acquisition cost of equity securities stated at fair value in long-term investment securities is recorded as gain on valuation of
available-for-sale securities in capital adjustments. The net gain on valuation of available-for-sale securities amounting to
565,217 million (US$471,879 thousand) in capital adjustments as of December 31, 2003 consists of loss on valuation of
short-term investment securities amounting to 498,518 million (US$416,195 thousand) and gain on valuation of long-term
investment securities amounting to 1,063,735 million (US$888,074 thousand).
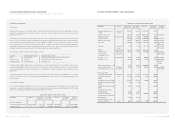
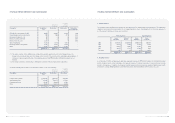
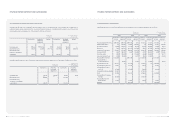
Equity securities stated at acquisition cost included in long-term investment securities as of December 31, 2003 consist of the
following:
Description Korean won U. S. dollars (Note 2)
(in millions) (in thousands)
Equity securities stated at fair value 1,632,936 $1,363,279
Equity securities stated at acquisition cost 173,243 144,634
Debt securities 1,704,053 1,422,653
3,510,232 $2,930,566
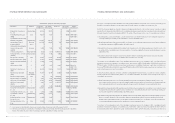
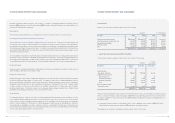
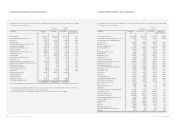
Equity securities stated at fair value included in long-term investment securities as of December 31, 2003 consist of
the following:
Companies Acquisition Book value Book value Ownership
cost percentage (*2)
INI Steel (*1) 137,175 247,264 $206,432 23.81
Hyundai MOBIS (*1) 132,056 1,120,347 935,337 20.61
Jin Heung Mutual Savings Bank 2,166 1,990 1,661 8.66
Korea Mutual Savings Bank 2,846 3,501 2,923 8.13
Saehan Media 4,933 3,284 2,742 6.52
Korea Information Service, Inc. 5,252 8,301 6,930 4.41
Daewoo Engineering & Construction Co., Ltd 42,483 56,945 47,541 3.06
Hyundai Heavy Industries Co., Ltd. 56,924 82,125 68,563 2.88
Daewoo International Corporation 9,822 17,301 14,444 2.51
Hyundai Information Technology Co., Ltd. 10,000 1,260 1,052 2.21
Korea Industrial Development Co., Ltd. 5,058 3,279 2,738 2.20
ICOLS Inc. 160 272 227 1.78
LG Telecom, Ltd. 19,851 13,536 11,301 1.34
Hyundai Corporation 13,626 747 624 1.08
Chohung Bank 73,545 26,705 22,295 0.95
Hyundai Merchant Marine Co., Ltd. 7,329 5,565 4,646 0.55
Hyundai Engineering & Construction Co., Ltd 13,332 3,053 2,549 0.53
Kanglim Co., Ltd 347 48 40 0.38
KT Freetel 18,000 10,627 8,872 0.29
Prochips Technology Inc. 904 33 28 0.22
Kia Steel Co., Ltd. 955 779 650 0.19
Hynix Semiconductor Inc. 2,047 4,043 3,375 0.16
Treasury Stock Fund 4,067 1,498 1,251 -
Stock Market Stabilization Fund 6,010 20,414 17,043 -
Other 313 19 15 -
569,201 1,632,936 $1,363,279
(*1) Excluded in applying the equity method since a part of ownership is restricted to voting rights in accordance with the laws
and the Company and subsidiaries believe there is no significant influence on the investees.
(*2) Ownership percentage is calculated by combining the ownership of the Company and its subsidiaries.
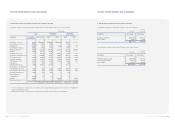
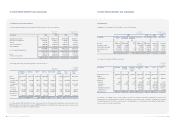
Korean won
(in millions)
U. S. dollars
(Note 2)
(in thousands) (%)
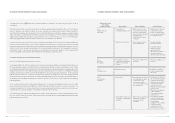
Companies Acquisition Book value Book value Ownership
cost percentage (*2)
Hyundai Jingxian Motor Safeguard
Service Co., Ltd. (*1) 2,019 2,019 $1,686 84.87
NGVTEK.com (*1) 571 571 477 53.66
Mco 950 950 793 19.99
Dongyong Industries Co., Ltd 241 241 201 19.35
Jinil MVC Co., Ltd. 180 180 150 18.00
Mobil.Com Co., Ltd. 1,800 1,800 1,503 17.39
Industri Otomotif Komersial 4,439 4,439 3,706 15.00
Hyundai Technology Investment Co., Ltd. 4,490 4,490 3,749 14.97
Hyundai Unicorns Co., Ltd. 5,795 137 114 14.90
Hyundai Research Institute 1,359 1,271 1,061 14.90
Gyeongnam Credit Guarantee Foundation 2,500 2,500 2,087 13.66
Kihyup Finance, Inc. 3,700 3,700 3,089 12.75
3Gcore, Inc 225 225 188 10.43
Hyundai Motor Deutschland GmbH 863 863 720 10.00
Wisco Co., Ltd 348 280 234 9.68
Hyundai Finance Corporation 9,888 9,888 8,255 9.29
Namyang Industrial Co., Ltd. 200 200 167 8.00
KOENTECH 1,550 1,550 1,294 7.50
Hankyoreh Plus Inc. 4,800 284 237 7.41
Hyundai Oil refinery Co., ltd. 88,857 88,857 74,184 7.24
Korea Credit-card Electronic-settlement
Service Co., Ltd 484 255 213 6.72
Hyundai Asan Corporation 22,500 8,861 7,398 5.00
Dongwon Capital Co., Ltd. 3,000 3,000 2,505 4.62
U.S Electrical Inc. 2,204 2,204 1,840 3.80
ROTIS 1,000 - - 3.76
KIS Information & Communication, Inc. 220 220 184 1.67
Yonhap Capital Co., Ltd. 10,500 10,500 8,766 1.49
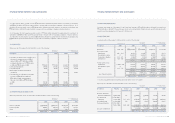
Korean won
(in millions)
U. S. dollars
(Note 2)
(in thousands)