Hyundai 2000 Annual Report Download - page 61
Download and view the complete annual report
Please find page 61 of the 2000 Hyundai annual report below. You can navigate through the pages in the report by either clicking on the pages listed below, or by using the keyword search tool below to find specific information within the annual report.-
 1
1 -
2
-
3
-
4
-
5
-
6
-
7
-
8
-
9
-
10
-
11
-
12
-
13
-
14
-
15
-
16
-
17
-
18
-
19
-
20
-
21
-
22
-
23
-
24
-
25
-
26
-
27
-
28
-
29
-
30
-
31
-
32
-
33
-
34
-
35
-
36
-
37
-
38
-
39
-
40
-
41
-
42
-
43
-
44
-
45
-
46
-
47
-
48
-
49
-
50
-
 51
51 -
 52
52 -
 53
53 -
 54
54 -
 55
55 -
 56
56 -
 57
57 -
 58
58 -
 59
59 -
 60
60 -
 61
61 -
 62
62 -
 63
63 -
 64
64 -
 65
65 -
 66
66 -
 67
67 -
 68
68 -
 69
69 -
 70
70 -
 71
71 -
72
-
73
-
74
 |
 |

59
2000 Annual Report •Hyundai-Motor Company
NOTES TO FINANCIAL STATEMENTS
December 31, 2000 and 1999
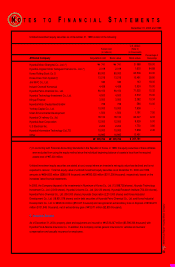
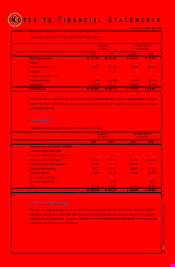
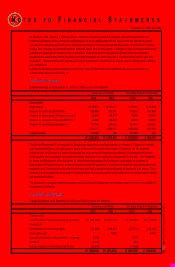
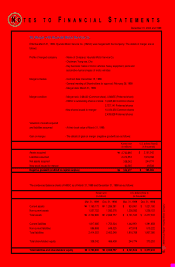
At January 1, 1981, January 1, 1993 and July 1, 1998, the Company revalued its property, plant and equipment at their
respective appraised values (which were appraised by the Korea Appraisal Board and approved by the relevant tax office).
The resultant cumulative appraisal gains, amounting to ₩2,547,417 million ($2,022,241 thousand), were included in capital
surplus, after offsetting accumulated deficit of ₩16,022 million ($12,719 thousand), a deferred foreign currency translation loss
of ₩594,275 million ($471,759 thousand), reduction for an asset revaluation tax payment of ₩67,547 million ($53,621
thousand) and adjustment of ₩16,702 million ($13,259 thousand) due to the disposal of revalued assets within 1 year after
revaluation. The asset revaluation surplus may only be transferred to capital stock or may be used to offset against a deficit, if
any, in the future.
In 2000, the increase in paid-in capital in excess of par value of ₩327,222 million ($259,762 thousand) arose from new
common stock issuance (See Note 13).
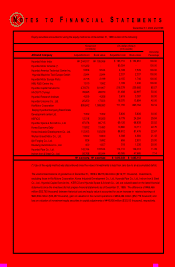
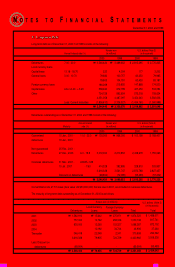
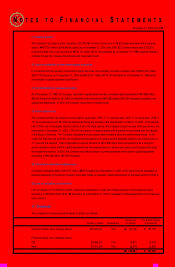
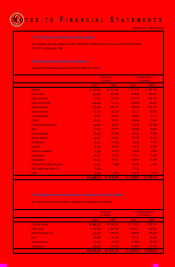
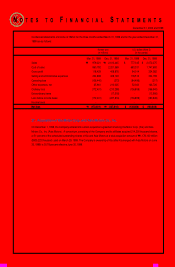
15.Retained Earnings
Retained earnings as of December 31, 2000 and 1999 consist of the following:
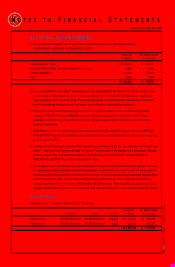
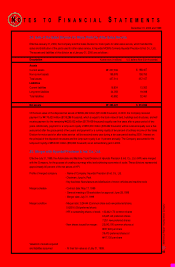
The Korean Commercial Code requires the Company to appropriate, as a legal reserve, a minimum of 10 percent of annual
cash dividends declared, until such reserve equals 50 percent of its capital stock issued. Pursuant to the Tax Incentive
Limitation Law, the Company is required to appropriate, as a reserve for business rationalization, the exemption of income
taxes resulting from investment tax credits and certain deductions from taxable income specified by the Law. The Regulation
on Issues and Disclosures of the Securities for listed companies requires the Company to appropriate, as a reserve for
improvement of financial structure, an amount equal to at least 50 percent of the net gain on disposition of property, plant and
equipment and 10 percent of net income for each year until the Company’s net worth equals 30 percent of total assets. These
reserves are not available for the payment of cash dividends, but may be transferred to capital stock or may be used to reduce
any accumulated deficit.
The reserves for overseas market development and technological development are voluntary reserves, which are available for
the payment of dividends.
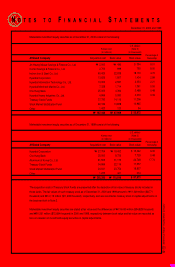
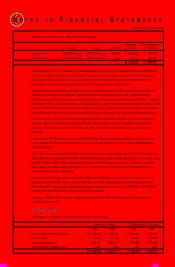
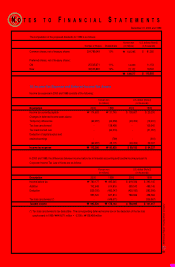
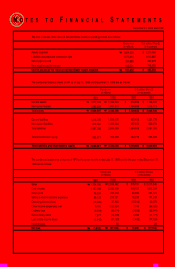
16. Capital Adjustments
Capital adjustments as of December 31, 2000 and 1999 consist of the following:
Appropriated:
Legal reserve
Reserve for business rationalization
Reserve for improvement of financial structure
Reserve for overseas market development
Reserve for technological development
Unappropriated
2000
$ 63,404
306,263
78,548
38,739
593,474
1,080,428
137,865
$ 1,218,293
1999
$ 50,226
211,955
78,548
38,739
462,491
841,959
156
$ 842,115
1999
₩63,270
267,000
98,947
48,800
582,600
1,060,617
196
₩
₩1,060,813
2000
₩79,870
385,800
98,947
48,800
747,600
1,361,017
173,667
₩
₩1,534,684
U.S. dollars (Note 2) (in thousands)Korean won (in millions)
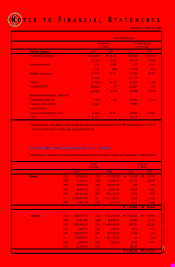
Treasury stock
Loss on valuation of investment equity securities
(see Note 4)
Consideration for conversion rights
Stock option cost
Cumulative translation adjustments for overseas
branches
Loss on valuation of derivatives (see Note 2)
2000
$ (346,948)
(207,700)
-
5,180
(853)
(44,198)
$ (594,519)
1999
$ (119,172)
(105,197)
6,340
-
-
-
$ (218,029)
1999
₩(150,121)
(132,517)
7,986
-
-
-
₩
₩(274,652)
2000
₩(437,050)
(261,640)
-
6,526
(1,075)
(55,676)
₩
₩(748,915)
U.S. dollars (Note 2) (in thousands)Korean won (in millions)