Hyundai 2000 Annual Report Download - page 50
Download and view the complete annual report
Please find page 50 of the 2000 Hyundai annual report below. You can navigate through the pages in the report by either clicking on the pages listed below, or by using the keyword search tool below to find specific information within the annual report.-
 1
1 -
2
-
3
-
4
-
5
-
6
-
7
-
8
-
9
-
10
-
11
-
12
-
13
-
14
-
15
-
16
-
17
-
18
-
19
-
20
-
21
-
22
-
23
-
24
-
25
-
26
-
27
-
28
-
29
-
30
-
31
-
32
-
33
-
34
-
35
-
36
-
37
-
38
-
39
-
 40
40 -
 41
41 -
 42
42 -
 43
43 -
 44
44 -
 45
45 -
 46
46 -
 47
47 -
 48
48 -
 49
49 -
 50
50 -
 51
51 -
 52
52 -
 53
53 -
 54
54 -
 55
55 -
 56
56 -
 57
57 -
 58
58 -
 59
59 -
 60
60 -
61
-
62
-
63
-
64
-
65
-
66
-
67
-
68
-
69
-
70
-
71
-
72
-
73
-
74
 |
 |

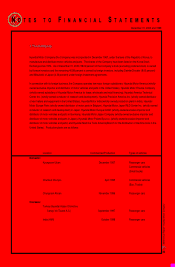
NOTES TO FINANCIAL STATEMENTS
December 31, 2000 and 1999
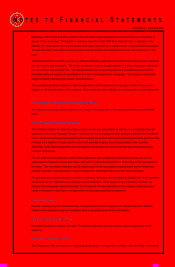
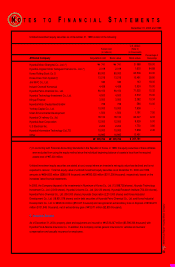
Income Tax Expense
The Company recognizes deferred income tax. Accordingly, income tax expense is determined by adding or deducting the
total income tax and surtaxes to be paid for the current period and the changes in deferred income tax debits (credits).
Earnings Per Share
Primary earnings per common share is computed by dividing net income, after deduction for expected dividends on preferred
stock, by the weighted average number of common shares outstanding during the year. The number of shares used in
computing earnings per common share is 199,249,370 in 2000 and 102,021,024 in 1999. Earnings per diluted share is
computed by dividing net income, after deduction for expected dividends on preferred stock and addition for the effect of
expenses related to diluted securities on net income, by the weighted average number of common shares plus the dilutive
potential common shares. The number of shares used in computing earnings per diluted share is 202,736,308 in 2000 and
106,331,915 in 1999.
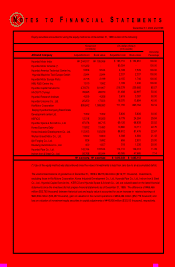
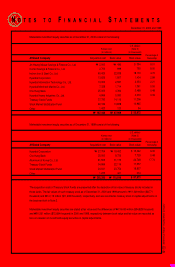
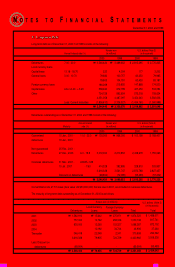
3.Inventories
Inventories as of December 31, 2000 and 1999 consist of the following
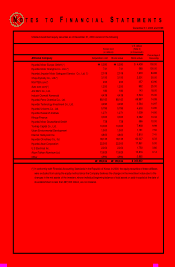
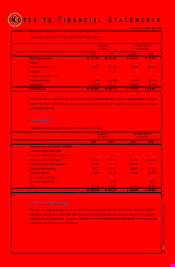
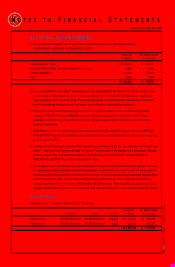
4. Marketable Securities and Investment Securities
(1) Marketable securities are stated at fair value and consist of beneficiary certificates of ₩129,917 million ($103,133
thousand) and debt securities of ₩54,573 million ($43,323 thousand) as of December 31, 2000 and beneficiary certificates
of ₩244,747 million ($194,290 thousand) and debt securities of₩61 million ($48 thousand) as of December 31, 1999.
(2) Investments securities as of December 31, 2000 and 1999 consist of the following:
Debt securities as of December 31, 2000 consist of convertible bonds of ₩33,903 million ($26,914 thousand), foreign currency
notes of ₩59,267 million ($47,049 thousand) and government bonds of ₩65 million ($51 thousand), which are all held-to-
maturity and stated at cost.
Debt securities as of December 31, 1999 are all held-to-maturity convertible bonds and are stated at cost.
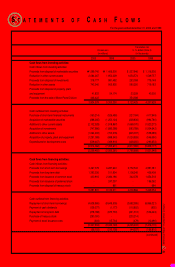
Finished goods and merchandise
Semifinished goods and work in process
Raw materials and supplies
Materials in transit
2000
$ 401,882
197,987
141,407
70,368
$ 811,644
1999
$ 376,381
153,409
124,679
59,095
$ 713,564
1999
₩474,127
193,249
157,059
74,442
₩
₩898,877
2000
₩506,251
249,404
178,131
88,642
₩
₩1,022,428
U.S. dollars (Note 2)
(in thousands)
Korean won
(in millions)
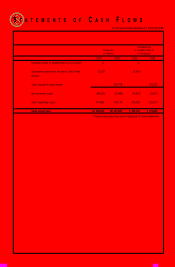
Equity securities accounted for using
the equity method
Marketable equity securities
Unlisted equity securities
Debt securities
2000
$ 1,863,013
53,972
205,632
74,014
$ 2,196,631
1999
$ 1,665,112
87,973
261,781
40,117
$ 2,054,983
1999
₩2,097,542
110,819
329,766
50,535
₩
₩2,588,662
2000
₩2,346,838
67,989
259,034
93,235
₩
₩2,767,096
U.S. dollars (Note 2)
(in thousands)
Korean won
(in millions)