Hyundai 2000 Annual Report Download - page 56
Download and view the complete annual report
Please find page 56 of the 2000 Hyundai annual report below. You can navigate through the pages in the report by either clicking on the pages listed below, or by using the keyword search tool below to find specific information within the annual report.-
 1
1 -
2
-
3
-
4
-
5
-
6
-
7
-
8
-
9
-
10
-
11
-
12
-
13
-
14
-
15
-
16
-
17
-
18
-
19
-
20
-
21
-
22
-
23
-
24
-
25
-
26
-
27
-
28
-
29
-
30
-
31
-
32
-
33
-
34
-
35
-
36
-
37
-
38
-
39
-
40
-
41
-
42
-
43
-
44
-
45
-
 46
46 -
 47
47 -
 48
48 -
 49
49 -
 50
50 -
 51
51 -
 52
52 -
 53
53 -
 54
54 -
 55
55 -
 56
56 -
 57
57 -
 58
58 -
 59
59 -
 60
60 -
 61
61 -
 62
62 -
 63
63 -
 64
64 -
 65
65 -
 66
66 -
67
-
68
-
69
-
70
-
71
-
72
-
73
-
74
 |
 |

NOTES TO FINANCIAL STATEMENTS
December 31, 2000 and 1999
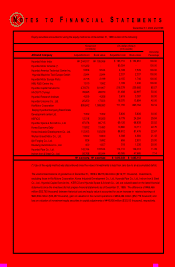
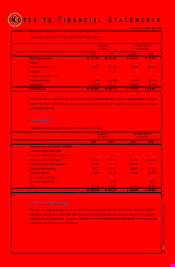
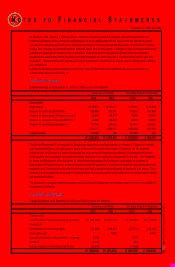
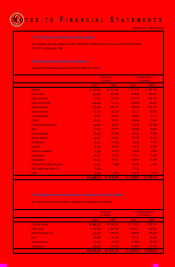
Buildings and structures
Machinery and equipment
Vehicles
Dies and moulds
Tools
Other equipment
Less: Accumulated depreciation
Land
Construction in progress
2000
$ 1,883,571
2,665,204
26,194
1,117,723
336,965
306,056
6,335,713
(1,825,699)
4,510,014
1,375,127
813,898
$ 6,699,039
1999
$ 1,786,995
2,457,347
23,525
917,492
301,754
271,136
5,758,249
(1,442,416)
4,315,833
1,335,713
666,110
$ 6,317,656
1999
₩2,251,078
3,095,520
29,635
1,155,764
380,119
341,550
7,253,666
(1,817,011)
5,436,655
1,682,598
839,099
₩
₩7,958,352
2000
₩2,372,734
3,357,358
32,996
1,407,996
424,475
385,539
7,981,098
(2,299,833)
5,681,265
1,732,247
1,025,268
₩
₩8,438,780
U.S. dollars (Note 2)
(in thousands)
Korean won
(in millions)
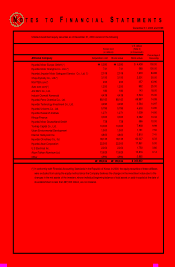
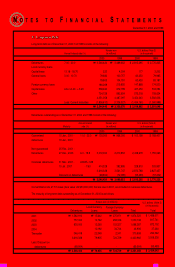
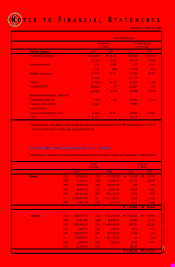
Cost in excess of fair value of net
identifiable assets acquired (see Note 25)
Development costs
Other
2000
$ 450,984
722,844
23,487
$ 1,197,315
1999
$ 475,251
418,947
23,656
$ 917,854
1999
₩598,674
527,748
29,799
₩
₩1,156,221
2000
₩568,104
910,566
29,587
₩
₩1,508,257
U.S. dollars (Note 2)
(in thousands)
Korean won
(in millions)
6. Property, Plant and Equipment
Property, plant and equipment as of December 31, 2000 and 1999 consist of the following:
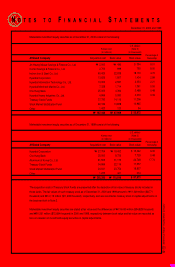
2001
2002
2003
2004
Thereafter
Lease
Payments
₩77,798
75,844
43,947
8,792
1,521
₩
₩207,902
Interest
Portion
₩11,719
6,676
2,549
414
52
₩
₩21,410
Lease
Obligations
₩66,079
69,198
41,398
8,378
1,469
₩
₩186,492
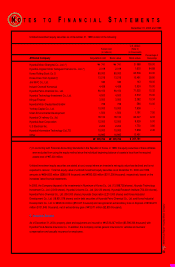
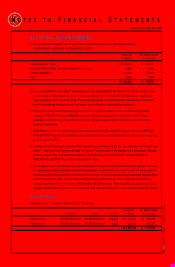
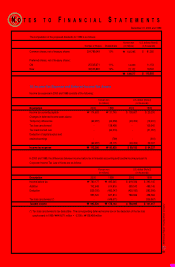
Financing leases
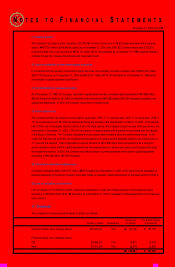
A substantial portion of the Company’s property, plant and equipment is pledged as collateral for various loans up to a
maximum of ₩1,187,660 million ($942,812 thousand) (see Notes 12).
As of December 31, 2000, the published value of the Company-owned land (11,939 thousand sq. meters) totals ₩1,517,951
million ($1,205,010 thousand) in terms of land prices officially announced by the Korean government.
7. Leased Assets
The Company has entered into financing lease agreements for certain machinery and equipment. The lease obligations are
included in long-term debt in the accompanying balance sheets. Annual payments on the lease agreements as of December
31, 2000 are as follows (won in millions):
8. Intangibles
Intangibles as of December 31, 2000 and 1999 consist of the unamortized balances of the following: