Hyundai 2000 Annual Report Download - page 52
Download and view the complete annual report
Please find page 52 of the 2000 Hyundai annual report below. You can navigate through the pages in the report by either clicking on the pages listed below, or by using the keyword search tool below to find specific information within the annual report.-
 1
1 -
2
-
3
-
4
-
5
-
6
-
7
-
8
-
9
-
10
-
11
-
12
-
13
-
14
-
15
-
16
-
17
-
18
-
19
-
20
-
21
-
22
-
23
-
24
-
25
-
26
-
27
-
28
-
29
-
30
-
31
-
32
-
33
-
34
-
35
-
36
-
37
-
38
-
39
-
40
-
41
-
 42
42 -
 43
43 -
 44
44 -
 45
45 -
 46
46 -
 47
47 -
 48
48 -
 49
49 -
 50
50 -
 51
51 -
 52
52 -
 53
53 -
 54
54 -
 55
55 -
 56
56 -
 57
57 -
 58
58 -
 59
59 -
 60
60 -
 61
61 -
 62
62 -
63
-
64
-
65
-
66
-
67
-
68
-
69
-
70
-
71
-
72
-
73
-
74
 |
 |

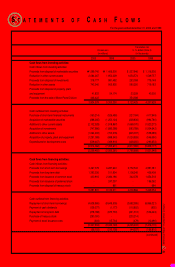
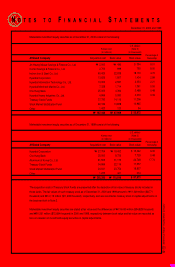
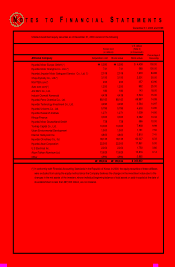
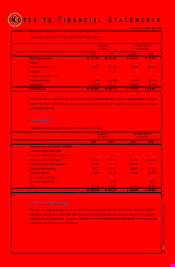
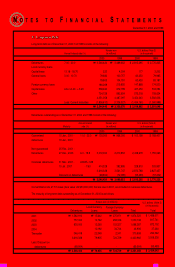
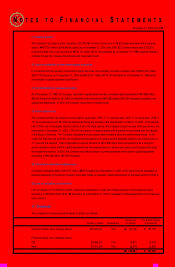
NOTES TO FINANCIAL STATEMENTS
December 31, 2000 and 1999
Hyundai Motor India
Hyundai Motor America (*)
Hyundai America Technical Center Inc.
Hyundai Machine Tool Europe GmbH
Hyundai Motor Europe Parts
HMJ R&D Center Inc.
Hyundai Capital Service Inc.
HAOSVT (Turkey)
Hyundai Research Institute
Hyundai Unicorns Co., Ltd.
Kia Motor Corporation
Beijing Hyundai Namyang Real Estate
Development center Ltd.
KEFICO
Hyundai Space & Aircraft Co., Ltd.
Korea Economy Daily
Korea Industrial Development Co., Ltd.
Wuhan Grand Motor Co., Ltd.
Iljin Forging Co., Ltd.
Daesung Automotive Co., Ltd.
Hyundai Pipe Co., Ltd.
Inchon Iron & Steel Co., Ltd.
Book value Ownership
Percentage
$ 154,851
-
7,576
2,337
1,746
1,240
239,666
22,997
3,387
13,894
863,764
5,836
24,264
68,838
10,711
81,476
4,684
2,931
1,236
106,013
47,665
$ 1,665,112
100.00
100.00
100.00
100.00
100.00
100.00
85.57
50.00
50.00
45.00
30.16
30.00
29.94
25.52
22.75
22.67
21.43
20.00
20.00
11.09
7.14
Acquisition cost
$ 193,710
80,354
4,728
2,337
2,155
1,199
216,379
31,488
3,619
16,075
711,155
5,836
9,779
69,126
10,980
88,912
4,368
656
318
114,110
45,065
$ 1,612,349
Book value
₩195,066
-
9,544
2,944
2,199
1,562
301,907
28,970
4,266
17,503
1,088,083
7,352
30,565
86,715
13,493
102,636
5,900
3,692
1,557
133,544
60,044
₩
₩2,097,542
AcquisitioncostAffiliated Company
₩244,017
101,222
5,956
2,944
2,715
1,510
272,573
39,665
4,559
20,250
895,842
7,352
12,318
87,078
13,832
112,003
5,502
826
400
143,744
56,768
₩
₩2,031,076
U.S. dollars (Note 2)
(in thousands)
Korean won
(in millions)
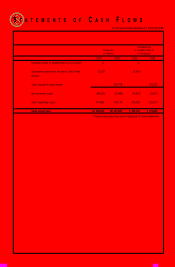
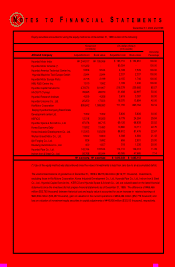
Equity securities accounted for using the equity method as of December 31, 1999 consist of the following:
(*) Use of the equity method was discontinued since the value of investments is less than zero due to an accumulated deficit.
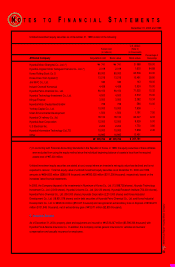
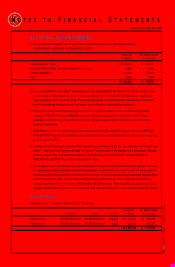
The unamortized balance of goodwill as of December 31, 1999 is ₩273,066 million ($216,771 thousand). Investments,
excluding those in Kia Motors Corporation, Korea Industrial Development Co., Ltd., Hyundai Pipe Co., Ltd., Inchon Iron & Steel
Co., Ltd., Hyundai Capital Service Inc., KEFICO and Hyundai Space & Aircraft Co., Ltd, are valued based on the latest financial
statements since the investees did not prepare financial statements as of December 31, 1999. The difference of ₩66,466
million ($52,763 thousand) between historical cost and equity value is accounted for as an increase in retained earnings of
₩40,936 million ($32,497 thousand), gain on valuation in the current operations of ₩66,486 million ($52,779 thousand) and
loss on valuation of investment equity securities in capital adjustments of ₩40,956 million ($32,513 thousand), respectively.