Huntington National Bank 2014 Annual Report Download - page 3
Download and view the complete annual report
Please find page 3 of the 2014 Huntington National Bank annual report below. You can navigate through the pages in the report by either clicking on the pages listed below, or by using the keyword search tool below to find specific information within the annual report.-
 1
1 -
 2
2 -
 3
3 -
 4
4 -
 5
5 -
 6
6 -
 7
7 -
 8
8 -
 9
9 -
 10
10 -
 11
11 -
 12
12 -
 13
13 -
 14
14 -
15
-
16
-
17
-
18
-
19
-
20
-
21
-
22
-
23
-
24
-
25
-
26
-
27
-
28
-
29
-
30
-
31
-
32
-
33
-
34
-
35
-
36
-
37
-
38
-
39
-
40
-
41
-
42
-
43
-
44
-
45
-
46
-
47
-
48
-
49
-
50
-
51
-
52
-
53
-
54
-
55
-
56
-
57
-
58
-
59
-
60
-
61
-
62
-
63
-
64
-
65
-
66
-
67
-
68
-
69
-
70
-
71
-
72
-
73
-
74
-
75
-
76
-
77
-
78
-
79
-
80
-
81
-
82
-
83
-
84
-
85
-
86
-
87
-
88
-
89
-
90
-
91
-
92
-
93
-
94
-
95
-
96
-
97
-
98
-
99
-
100
-
101
-
102
-
103
-
104
-
105
-
106
-
107
-
108
-
109
-
110
-
111
-
112
-
113
-
114
-
115
-
116
-
117
-
118
-
119
-
120
-
121
-
122
-
123
-
124
-
125
-
126
-
127
-
128
-
129
-
130
-
131
-
132
-
133
-
134
-
135
-
136
-
137
-
138
-
139
-
140
-
141
-
142
-
143
-
144
-
145
-
146
-
147
-
148
-
149
-
150
-
151
-
152
-
153
-
154
-
155
-
156
-
157
-
158
-
159
-
160
-
161
-
162
-
163
-
164
-
165
-
166
-
167
-
168
-
169
-
170
-
171
-
172
-
173
-
174
-
175
-
176
-
177
-
178
-
179
-
180
-
181
-
182
-
183
-
184
-
185
-
186
-
187
-
188
-
189
-
190
-
191
-
192
-
193
-
194
-
195
-
196
-
197
-
198
-
199
-
200
-
201
-
202
-
203
-
204
-
205
-
206
-
207
-
208
 |
 |
TO FELLOW OWNERS AND FRIENDS:
I am pleased to report 2014 was another solid year for Huntington. Our colleagues remain focused on
delivering high performance and creating value for our customers and shareholders as we continue to manage
through this challenging operating environment. Over the last five years, we have created a culture and
positioned the Company to reduce risk and deliver more stable returns through the cycle. This year was the fourth
year in a row with a return on average assets of over 1% and a return on average tangible common equity of 12%.
These results allowed the Company to return over $500 million of our net income to our investors through an
increased dividend and a share repurchase program, while also supporting continued investments and double-
digit balance sheet growth.
Our performance is driven by the execution of our differentiated strategy. We have positioned Huntington
uniquely in an industry that many would consider filled with “me-too’s.” We know this because year after year,
we receive multiple awards from the likes of J.D. Power, Greenwich Associates, and the Small Business
Administration; we received regulatory approval for our third-quarter acquisition in near record time; and we
read the results of independent surveys that place us top in our region for the most favorable brand and highest
levels of net promoter score. At a time of growing competition from not only banks, but the ever-increasing
number of nonregulated entities, what is more important than those external accolades is what we hear from our
customers and how they interact with us. Since 2010, the number of consumer households has grown by 48% and
commercial relationships increased by 30%. At the same time, customers are doing more with us: the number of
customers using 4+ products has increased by over 10% to nearly 80% for consumer households and nearly
doubled to reach 42% for commercial relationships.
The growth in our revenue, improved credit quality, and strong capital levels demonstrated how Huntington
colleagues have risen to meet the challenges of the current banking environment. Let me offer a recap of 2014
performance and then our expectations for 2015.
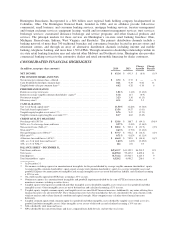
In 2014, we reported net income of $632 million, or $0.72 per common share, relatively unchanged from the
prior year. Fully taxable equivalent total revenue increased $100 million, or 4%, which is at the lower end of our
new long-term goal of 4%-6% revenue growth. Fully-taxable equivalent net interest income increased $133
million, or 8%, while noninterest income decreased by $33 million, or 3%. Importantly, we delivered on our
commitment of positive operating leverage, and as we adjusted our long-term through-the-cycle financial goals
that we first laid out in 2010, we crystalized that commitment by formally including positive operating leverage
as one of our five goals.
The net interest income increase reflected the impact of 12% earning asset growth and a 13 basis points
decrease in the net interest margin to 3.23%. The earning asset growth reflected a $3.6 billion, or 9%, increase in
average loans and leases and a $2.7 billion, or 29%, increase in average securities. Automobile loans and
Commercial and Industrial (C&I) loans, two areas of significant focus of our strategic investments of the last
several years, drove the majority of the loan growth. The securities growth primarily reflected our preparation for
the 2016 phase-in implementation of the modified liquidity coverage ratio (LCR) requirement by U.S. banking
regulators.
We continue to be dynamic in how we fund our balance sheet growth, and over the course of 2014, we
reduced funding costs by 9 basis points by remaining focused on building primary banking relationships. That
resulted in growth of over $2.2 billion of core deposits, including $1.1 billion of noninterest-bearing demand
deposits. The largest source of interest-bearing liability growth was from the $3.2 billion increase in short- and
long-term borrowings. Borrowings have been a cost effective method to fund our incremental securities growth,
and the change in deposit mix reflects our strategic focus on changing funding sources.
The decrease in noninterest income of $33 million, or 3%, primarily reflected the $42 million decline in
mortgage banking income as originations decreased, the gain-on-sale margins compressed, and was negatively
1