Huntington National Bank 2003 Annual Report Download - page 8
Download and view the complete annual report
Please find page 8 of the 2003 Huntington National Bank annual report below. You can navigate through the pages in the report by either clicking on the pages listed below, or by using the keyword search tool below to find specific information within the annual report.-
 1
1 -
 2
2 -
 3
3 -
 4
4 -
 5
5 -
 6
6 -
 7
7 -
 8
8 -
 9
9 -
 10
10 -
 11
11 -
 12
12 -
 13
13 -
 14
14 -
 15
15 -
 16
16 -
 17
17 -
 18
18 -
 19
19 -
20
-
21
-
22
-
23
-
24
-
25
-
26
-
27
-
28
-
29
-
30
-
31
-
32
-
33
-
34
-
35
-
36
-
37
-
38
-
39
-
40
-
41
-
42
-
43
-
44
-
45
-
46
-
47
-
48
-
49
-
50
-
51
-
52
-
53
-
54
-
55
-
56
-
57
-
58
-
59
-
60
-
61
-
62
-
63
-
64
-
65
-
66
-
67
-
68
-
69
-
70
-
71
-
72
-
73
-
74
-
75
-
76
-
77
-
78
-
79
-
80
-
81
-
82
-
83
-
84
-
85
-
86
-
87
-
88
-
89
-
90
-
91
-
92
-
93
-
94
-
95
-
96
-
97
-
98
-
99
-
100
-
101
-
102
-
103
-
104
-
105
-
106
-
107
-
108
-
109
-
110
-
111
-
112
-
113
-
114
-
115
-
116
-
117
-
118
-
119
-
120
-
121
-
122
-
123
-
124
-
125
-
126
-
127
-
128
-
129
-
130
-
131
-
132
-
133
-
134
-
135
-
136
-
137
-
138
-
139
-
140
-
141
-
142
-
143
-
144
-
145
-
146
 |
 |

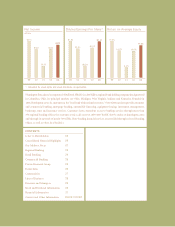
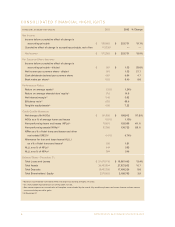
CONSOLIDATED FINANCIAL HIGHLIGHTS
in thousands, except per share amounts 2003 2002 % Change
Net Income
Income before cumulative effect of change in
accounting principle $ 385,693 $ 323,731 19.1%
Cumulative effect of change in accounting principle, net of tax (13,330) ——
Net Income $ 372,363 $ 323,731 15.0%
Per Common Share Amounts
Income before cumulative effect of change in
accounting principle – diluted $ 1.67 $ 1.33 25.6%
Net income per common share – diluted 1.61 1.33 21.1
Cash dividends declared per common share 0.67 0.64 4.7
Book value per share(4) 9.93 9.40 5.6
Performance Ratios
Return on average assets(1) 1.33% 1.24%
Return on average shareholders’ equity(1) 17.6 14.5
Net interest margin(2) 3.49 3.62
Efficiency ratio(3) 63.9 65.6
Tangible equity/assets(4) 6.80 7.22
Credit Quality Measures
Net charge-offs (NCOs) $ 161,809 $ 196,912 (17.8)%
NCOs as a % of average loans and leases 0.81% 1.13%
Non-performing loans and leases (NPLs)(4) 75,481 128,069 (41.1)
Non-performing assets (NPAs)(4) 87,386 136,723 (36.1)
NPAs as a % of total loans and leases and other
real estate (OREO)(4) 0.41% 0.74%
Allowance for loan and lease losses (ALLL)
as a % of total loans and leases(4) 1.59 1.81
ALLL as a % of NPLs(4) 444 263
ALLL as a % of NPAs(4) 384 246
Balance Sheet – December 31,
Total Loans and Leases $ 21,075,118 $ 18,587,403 13.4%
Total Assets 30,483,804 27,527,932 10.7
Total Deposits 18,487,395 17,499,326 5.6
Total Shareholders’ Equity 2,275,002 2,189,793 3.9
(1) Based on income before cumulative effect of change in accounting principle, net of tax.
(2) On a fully taxable equivalent basis assuming a 35% tax rate.
(3) Non-interest expense less amortization of intangible assets divided by the sum of fully taxable equivalent net interest income and non-interest
income excluding securities gains.
(4) At December 31.
HUNTINGTON BANCSHARES INCORPORATED
6