Hormel Foods 2015 Annual Report Download - page 64
Download and view the complete annual report
Please find page 64 of the 2015 Hormel Foods annual report below. You can navigate through the pages in the report by either clicking on the pages listed below, or by using the keyword search tool below to find specific information within the annual report.-
 1
1 -
2
-
3
-
4
-
5
-
6
-
7
-
8
-
9
-
10
-
11
-
12
-
13
-
14
-
15
-
16
-
17
-
18
-
19
-
20
-
21
-
22
-
23
-
24
-
25
-
26
-
27
-
28
-
29
-
30
-
31
-
32
-
33
-
34
-
35
-
36
-
37
-
38
-
39
-
40
-
41
-
42
-
43
-
44
-
45
-
46
-
47
-
48
-
49
-
50
-
51
-
52
-
53
-
 54
54 -
 55
55 -
 56
56 -
 57
57 -
 58
58 -
 59
59 -
 60
60 -
 61
61 -
 62
62 -
 63
63 -
 64
64 -
 65
65 -
 66
66 -
 67
67 -
 68
68 -
 69
69 -
 70
70
 |
 |

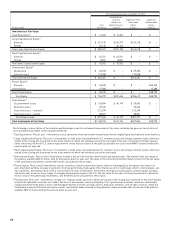
62
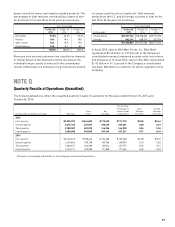
(in thousands) 2015 2014 2013
Net Sales (to unaffi liated
customers)
Grocery Products $ 1,617,680 $ 1,558,265 $ 1,517,557
Refrigerated Foods 4,372,347 4,644,179 4,251,515
Jennie-O Turkey Store 1,635,776 1,672,452 1,601,868
Specialty Foods 1,103,359 907,120 932,533
International & Other 534,701 534,240 448,181
Total $ 9,263,863 $ 9,316,256 $ 8,751,654
Intersegment Sales
Grocery Products $ – $ – $ –
Refrigerated Foods 13,058 23,163 17,359
Jennie-O Turkey Store 128,195 144,137 123,420
Specialty Foods 64 122 108
International & Other – – –
Total 141,317 167,422 140,887
Intersegment
elimination (141,317) (167,422) (140,887)
Total $ – $ – $ –
Segment Net Sales
Grocery Products $ 1,617,680 $ 1,558,265 $ 1,517,557
Refrigerated Foods 4,385,405 4,667,342 4,268,874
Jennie-O Turkey Store 1,763,971 1,816,589 1,725,288
Specialty Foods 1,103,423 907,242 932,641
International & Other 534,701 534,240 448,181
Intersegment
elimination (141,317) (167,422) (140,887)
Total $ 9,263,863 $ 9,316,256 $ 8,751,654
Segment Operating Profi t
Grocery Products $ 228,582 $ 195,064 $ 213,646
Refrigerated Foods 424,968 338,020 232,692
Jennie-O Turkey Store 276,217 272,362 222,117
Specialty Foods 93,258 71,514 88,873
International & Other 78,318 84,745 71,490
Total segment
operating profi t $ 1,101,343 $ 961,705 $ 828,818
Net interest and
investment expense
(income) 10,177 9,468 7,482
General corporate
expense 35,199 33,434 26,694
Noncontrolling interest 1,176 3,349 3,865
Earnings Before
Income Taxes $ 1,057,143 $ 922,152 $ 798,507
(in thousands) 2015 2014 2013
Assets
Grocery Products $ 1,214,988 $ 1,249,631 $ 1,237,405
Refrigerated Foods 1,973,424 1,215,694 1,218,418
Jennie-O Turkey Store 811,693 857,697 819,343
Specialty Foods 988,455 1,013,420 469,599
International & Other 446,164 406,249 361,038
Corporate 705,107 712,928 810,077
Total $ 6,139,831 $ 5,455,619 $ 4,915,880
Additions to Property,
Plant and Equipment
Grocery Products $ 18,104 $ 31,741 $ 10,100
Refrigerated Foods 54,074 61,183 58,523
Jennie-O Turkey Store 32,250 25,761 22,863
Specialty Foods 5,309 3,266 3,606
International & Other 18,576 4,896 2,973
Corporate 15,750 32,291 8,697
Total $ 144,063 $ 159,138 $ 106,762
Depreciation and
Amortization
Grocery Products $ 26,972 $ 25,883 $ 22,912
Refrigerated Foods 53,325 57,709 57,879
Jennie-O Turkey Store 28,262 27,091 26,921
Specialty Foods 11,075 8,999 9,232
International & Other 3,372 3,541 1,906
Corporate 10,428 6,821 6,000
Total $ 133,434 $ 130,044 $ 124,850
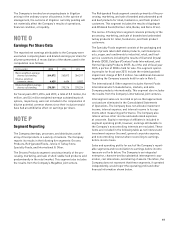
The Company’s products primarily consist of meat and other
food products. The Perishable category includes fresh meats,
frozen items, refrigerated meal solutions, sausages, hams,
wieners, guacamole, and bacon (excluding JOTS products).
The Poultry category is composed primarily of JOTS products.
Shelf-stable includes canned luncheon meats, shelf-stable
microwaveable meals, stews, chilies, hash, meat spreads,
fl our and corn tortillas, salsas, tortilla chips, peanut but-
ter, and other items that do not require refrigeration. The
Miscellaneous category primarily consists of nutritional food
products and supplements, sugar and sugar substitutes,