Hormel Foods 2015 Annual Report Download - page 54
Download and view the complete annual report
Please find page 54 of the 2015 Hormel Foods annual report below. You can navigate through the pages in the report by either clicking on the pages listed below, or by using the keyword search tool below to find specific information within the annual report.-
 1
1 -
2
-
3
-
4
-
5
-
6
-
7
-
8
-
9
-
10
-
11
-
12
-
13
-
14
-
15
-
16
-
17
-
18
-
19
-
20
-
21
-
22
-
23
-
24
-
25
-
26
-
27
-
28
-
29
-
30
-
31
-
32
-
33
-
34
-
35
-
36
-
37
-
38
-
39
-
40
-
41
-
42
-
43
-
 44
44 -
 45
45 -
 46
46 -
 47
47 -
 48
48 -
 49
49 -
 50
50 -
 51
51 -
 52
52 -
 53
53 -
 54
54 -
 55
55 -
 56
56 -
 57
57 -
 58
58 -
 59
59 -
 60
60 -
 61
61 -
 62
62 -
 63
63 -
 64
64 -
65
-
66
-
67
-
68
-
69
-
70
 |
 |

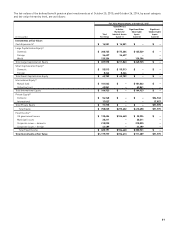
52
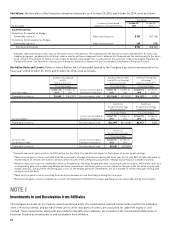
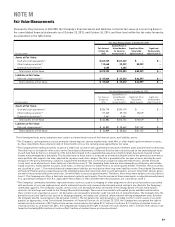
Fair Value Measurements at October 26, 2014
Quoted Prices
in Active Signifi cant Other Signifi cant
Markets for Observable Unobservable
Total Identical Assets Inputs Inputs
(in thousands) Fair Value (Level 1) (Level 2 (Level 3)
Investments at Fair Value:
Cash Equivalents(1) $ 14,342 $ 14,342 $ – $ –
Large Capitalization Equity(2)
Domestic $ 351,195 $ 196,977 $ 154,218 $ –
Foreign 34,126 34,126 – –
Total Large Capitalization Equity $ 385,321 $ 231,103 $ 154,218 $ –
Small Capitalization Equity(3)
Domestic $ 62,521 $ 62,521 $ – $ –
Foreign 8,031 8,031 – –
Total Small Capitalization Equity $ 70,552 $ 70,552 $ – $ –
International Equity(4)
Mutual fund $ 69,393 $ – $ 69,393 $ –
Collective trust 173,008 – 173,008 –
Total International Equity $ 242,401 $ – $ 242,401 $ –
Private Equity(5)
Domestic $ 43,340 $ – $ – $ 43,340
International 15,383 – – 15,383
Total Private Equity $ 58,723 $ – $ – $ 58,723
Total Equity $ 756,997 $ 301,655 $ 396,619 $ 58,723
Fixed Income(6)
US government issues $ 126,894 $ 96,199 $ 30,695 $ –
Municipal issues 20,232 – 20,232 –
Corporate issues – domestic 212,299 – 212,299 –
Corporate issues – foreign 38,001 – 38,001 –
Total Fixed Income $ 397,426 $ 96,199 $ 301,227 $ –
Total Investments at Fair Value $ 1,168,765 $ 412,196 $ 697,846 $ 58,723
The following is a description of the valuation methodologies used for instruments measured at fair value, including the general classifi cation of
such instruments pursuant to the valuation hierarchy:
(1)
Cash Equivalents: These Level 1 investments consist primarily of money market mutual funds that are highly liquid and traded in active markets.
(2)
Large Capitalization Equity: The Level 1 investments include a mix of predominately U.S. common stocks and foreign common stocks, which are
valued at the closing price reported on the active market in which the individual securities are traded. The Level 2 investment includes mutual
funds consisting of a mix of U.S. and foreign common stocks that are valued at the publicly available net asset value (NAV) of shares held by the
pension plans at year end.
(3)
Small Capitalization Equity: The Level 1 investments include a mix of predominately U.S. common stocks and foreign common stocks, which are
valued at the closing price reported on the active market in which the individual securities are traded.
(4)
International Equity: These Level 2 investments include a mix of collective investment funds and mutual funds. The mutual funds are valued at
the publicly available NAV of shares held by the pension plans at year end. The value of the collective investment funds is based on the fair value
of the underlying investments and the NAV can be calculated for these funds.
(5)
Private Equity: These Level 3 investments consist of various collective investment funds, which are managed by a third party, that invest in a
well-diversifi ed portfolio of equity investments from top performing, high quality fi rms that focus on U.S. and foreign small to mid-markets, ven-
ture capitalists, and entrepreneurs with a concentration in areas of innovation. Investment strategies include buyouts, growth capital, buildups,
and distressed, as well as early stages of company development mainly in the U.S. The fair value of the units for these investments is based on
the fair value of the underlying investments, and the NAV can be calculated for these funds.
(6) Fixed Income: The Level 1 investments include U.S. Treasury bonds and notes, which are valued at the closing price reported on the active market
in which the individual securities are traded. The Level 2 investments consist principally of U.S. government securities, which are valued daily
using institutional bond quote sources and mortgage-backed securities pricing sources; municipal, domestic, and foreign securities, which are
valued daily using institutional bond quote sources; and mutual funds invested in long-duration corporate bonds that are valued at the publicly
available NAV of shares held by the pension plans at year-end.