Graco 2005 Annual Report Download - page 16
Download and view the complete annual report
Please find page 16 of the 2005 Graco annual report below. You can navigate through the pages in the report by either clicking on the pages listed below, or by using the keyword search tool below to find specific information within the annual report.-
 1
1 -
2
-
3
-
4
-
5
-
 6
6 -
 7
7 -
 8
8 -
 9
9 -
 10
10 -
 11
11 -
 12
12 -
 13
13 -
 14
14 -
 15
15 -
 16
16 -
 17
17 -
 18
18 -
 19
19 -
 20
20 -
 21
21 -
 22
22 -
 23
23 -
 24
24 -
 25
25 -
 26
26 -
27
-
28
-
29
-
30
-
31
-
32
-
33
-
34
-
35
-
36
-
37
-
38
-
39
-
40
-
41
-
42
-
43
-
44
-
45
-
46
-
47
-
48
-
49
-
50
-
51
-
52
-
53
-
54
-
55
-
56
-
57
-
58
-
59
-
60
-
61
-
62
-
63
-
64
-
65
-
66
-
67
-
68
-
69
-
70
-
71
-
72
-
73
-
74
-
75
-
76
-
77
-
78
-
79
-
80
-
81
 |
 |
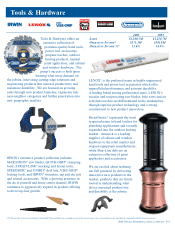
Net sales in the Company's Invest businesses improved 2.0% for 2005 versus 2004, led by double digit
growth in the LENOX tools businesses and high single digit growth in Rubbermaid Commercial Products
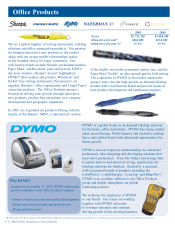
and IRWIN- branded tools businesses. The acquisition of DYMO contributed $24.9 million in net sales in
2005.
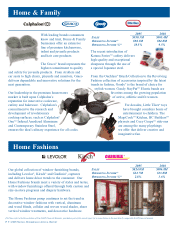
Net sales in the Company's Fix businesses declined 8.0% for 2005 versus 2004, as a result of low
margin product line exits in Rubbermaid Home Products and core sales declines in the Little Tikes battery
operated products and European Window Fashion businesses.
Gross margin, as a percentage of net sales, for 2005 was 29.9%, or $1,894.4 million, versus 28.4%, or
$1,838.8 million, for 2004. The improvement in gross margin is primarily related to favorable pricing of
$132 million, or 2.0% of net sales, gross productivity of $87 million, and favorable mix driven by the
rationalization of unproÑtable product lines primarily in the Rubbermaid Home Products business, partially
oÅset by raw material inÖation of $153 million (primarily resin and steel) and the impact of the core sales
decline.
Selling, general and administrative expenses (SG&A) for 2005 were 20.0% of net sales, or
$1,265.6 million, versus 18.7%, or $1,208.8 million, for 2004. The increase in SG&A reÖects a currency
impact of $11.0 million, a $9.0 million impact from the acquisition of DYMO and strategic investments in
Invest businesses, partially oÅset by streamlining in the Company's Fix businesses.
The Company recorded non-cash pre-tax impairment charges of $34.4 million and $295.1 million for
2005 and 2004, respectively. The 2005 charges were required to write-down certain assets to fair value,
including goodwill, trademarks and trade names related to the Company's United Kingdom Home
Fashions business. The 2004 charges were required to write-down certain assets to fair value, primarily in
the Company's European and Latin American OÇce Products businesses. See Footnote 18 to the
Consolidated Financial Statements for additional information.
The Company recorded restructuring costs of $72.2 million and $44.2 million for 2005 and 2004,
respectively. The 2005 restructuring costs included $51.3 million in non-cash facility restructuring charges
relating to Project Acceleration and $20.9 million relating to restructuring actions approved prior to the
commencement of Project Acceleration. The $20.9 million of pre-Project Acceleration costs included
$7.7 million of facility and other exit costs, $11.4 million of employee severance and termination beneÑts
and $1.8 million of exited contractual commitments and other restructuring costs. The 2004 costs included
$39.6 million of facility and other exit costs, $3.0 million of employee severance and termination beneÑts
and $1.6 million of exited contractual commitments and other restructuring costs. See Footnote 4 to the
Consolidated Financial Statements for further information on the restructuring costs.
Operating income for 2005 was $522.2 million, or 8.2% of net sales, versus $290.7 million, or 4.5% of
net sales, in 2004. The improvement in operating margins is the result of the factors described above.
Net non-operating expenses for 2005 were 1.6% of net sales, or $104.1 million, versus 1.8% of net
sales, or $116.1 million, for 2004. The decrease in net non-operating expenses is mainly attributable to
gains recognized in 2005 on the sale of property, plant and equipment and the liquidation of a foreign
subsidiary. This was partially oÅset by an increase in net interest expense, $127.1 million for 2005
compared to $119.3 million for 2004. The increase in net interest expense was primarily due to higher
borrowing rates, partially oÅset by lower average debt balances. See Footnote 19 to the Consolidated
Financial Statements for further information.
The eÅective tax rate was 14.8% for 2005 versus 59.6% for 2004. The change in the eÅective tax rate
is primarily related to the $73.9 million income tax beneÑt recorded in 2005 compared to the net income
tax beneÑt of $15.5 million recorded in 2004, as a result of favorable resolution of certain tax positions and
the expiration of the statute of limitations on other deductions. Additionally, the eÅective tax rate was
impacted by the non-deductibility associated with a portion of the Company's impairment charges
recorded in 2005 and 2004 ($34.4 million and $295.1 million, respectively). See Footnotes 17 and 18 to
the Consolidated Financial Statements for further information.
15