Graco 2005 Annual Report Download - page 15
Download and view the complete annual report
Please find page 15 of the 2005 Graco annual report below. You can navigate through the pages in the report by either clicking on the pages listed below, or by using the keyword search tool below to find specific information within the annual report.-
 1
1 -
2
-
3
-
4
-
 5
5 -
 6
6 -
 7
7 -
 8
8 -
 9
9 -
 10
10 -
 11
11 -
 12
12 -
 13
13 -
 14
14 -
 15
15 -
 16
16 -
 17
17 -
 18
18 -
 19
19 -
 20
20 -
 21
21 -
 22
22 -
 23
23 -
 24
24 -
 25
25 -
26
-
27
-
28
-
29
-
30
-
31
-
32
-
33
-
34
-
35
-
36
-
37
-
38
-
39
-
40
-
41
-
42
-
43
-
44
-
45
-
46
-
47
-
48
-
49
-
50
-
51
-
52
-
53
-
54
-
55
-
56
-
57
-
58
-
59
-
60
-
61
-
62
-
63
-
64
-
65
-
66
-
67
-
68
-
69
-
70
-
71
-
72
-
73
-
74
-
75
-
76
-
77
-
78
-
79
-
80
-
81
 |
 |

European Cookware business, completing this sale in January 2006. The Company will continue to review
opportunities to optimize the portfolio through selective acquisitions and divestitures.
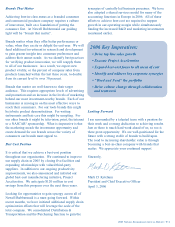
Streamline Non-Strategic SG&A
In 2006, the Company will continue to streamline its non-strategic SG&A, especially in its Fix
businesses, by challenging non-strategic costs and SG&A investments in these businesses. The Company
plans to use those savings to fund investments in SG&A in its Invest businesses, primarily through
increased advertising, new product development, promotion and brand building activities.
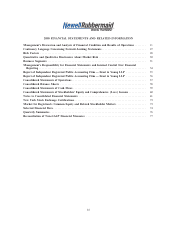
Consolidated Results of Operations
The following table sets forth for the periods indicated items from the Consolidated Statements of
Operations as reported and as a percentage of net sales for the years ended December 31, (in millions,
except percentages):
2005 2004 2003
Net sales ÏÏÏÏÏÏÏÏÏÏÏÏÏÏÏÏÏÏÏÏÏÏÏ $6,342.5 100.0% $6,479.8 100.0% $6,614.8 100.0%
Cost of products sold ÏÏÏÏÏÏÏÏÏÏÏÏÏ 4,448.1 70.1 4,641.0 71.6 4,732.7 71.5
Gross margin ÏÏÏÏÏÏÏÏÏÏÏÏÏÏÏÏÏÏÏÏ 1,894.4 29.9 1,838.8 28.4 1,882.1 28.5
Selling, general and administrative
expenses ÏÏÏÏÏÏÏÏÏÏÏÏÏÏÏÏÏÏÏÏÏÏ 1,265.6 20.0 1,208.8 18.7 1,160.7 17.5
Impairment charges ÏÏÏÏÏÏÏÏÏÏÏÏÏÏ 34.4 0.5 295.1 4.6 34.5 0.5
Restructuring costs ÏÏÏÏÏÏÏÏÏÏÏÏÏÏÏ 72.2 1.1 44.2 0.7 189.3 2.9
Operating income ÏÏÏÏÏÏÏÏÏÏÏÏÏÏÏÏ 522.2 8.2 290.7 4.5 497.6 7.5
Nonoperating expenses:
Interest expense, netÏÏÏÏÏÏÏÏÏÏ 127.1 2.0 119.3 1.8 134.3 2.0
Other (income) expense, netÏÏÏ (23.0) (0.4) (3.2) Ì 25.6 0.4
Net nonoperating expenses ÏÏÏÏÏÏ 104.1 1.6 116.1 1.8 159.9 2.4
Income from continuing operations
before income taxes ÏÏÏÏÏÏÏÏÏÏÏÏ 418.1 6.6 174.6 2.7 337.7 5.1
Income taxes ÏÏÏÏÏÏÏÏÏÏÏÏÏÏÏÏÏÏÏÏ 61.7 1.0 104.0 1.6 119.8 1.8
Income from continuing operationsÏÏ 356.4 5.6 70.6 1.1 217.9 3.3
Loss from discontinued operations,
net of tax ÏÏÏÏÏÏÏÏÏÏÏÏÏÏÏÏÏÏÏÏÏ (105.1) (1.7) (186.7) (2.9) (264.5) (4.0)
Net income (loss) ÏÏÏÏÏÏÏÏÏÏÏÏÏÏÏ $ 251.3 4.0% $ (116.1) (1.8)% ($46.6) (0.7)%
Results of OperationsÌ2005 vs. 2004
Net sales for 2005 were $6,342.5 million, representing a decrease of $137.3 million, or 2.1% from
$6,479.8 million for 2004, consisting of the following (in millions, except percentages):
$%
Favorable currency translationÏÏÏÏÏÏÏÏÏÏÏÏÏÏÏÏÏÏÏÏÏÏÏÏÏÏÏÏÏÏÏÏÏÏÏÏÏÏÏÏÏÏÏÏ $ 48 0.7%
Favorable pricingÏÏÏÏÏÏÏÏÏÏÏÏÏÏÏÏÏÏÏÏÏÏÏÏÏÏÏÏÏÏÏÏÏÏÏÏÏÏÏÏÏÏÏÏÏÏÏÏÏÏÏÏÏÏÏ 132 2.0
Product line rationalization ÏÏÏÏÏÏÏÏÏÏÏÏÏÏÏÏÏÏÏÏÏÏÏÏÏÏÏÏÏÏÏÏÏÏÏÏÏÏÏÏÏÏÏÏÏÏ (200) (3.1)
Core sales decline ÏÏÏÏÏÏÏÏÏÏÏÏÏÏÏÏÏÏÏÏÏÏÏÏÏÏÏÏÏÏÏÏÏÏÏÏÏÏÏÏÏÏÏÏÏÏÏÏÏÏÏÏÏÏ (142) (2.1)
Acquired business sales ÏÏÏÏÏÏÏÏÏÏÏÏÏÏÏÏÏÏÏÏÏÏÏÏÏÏÏÏÏÏÏÏÏÏÏÏÏÏÏÏÏÏÏÏÏÏÏÏÏ 25 0.4
$(137) (2.1)%
14