Goldman Sachs 2009 Annual Report Download - page 2
Download and view the complete annual report
Please find page 2 of the 2009 Goldman Sachs annual report below. You can navigate through the pages in the report by either clicking on the pages listed below, or by using the keyword search tool below to find specific information within the annual report.-
 1
1 -
 2
2 -
 3
3 -
 4
4 -
 5
5 -
 6
6 -
 7
7 -
 8
8 -
 9
9 -
 10
10 -
 11
11 -
 12
12 -
 13
13 -
14
-
15
-
16
-
17
-
18
-
19
-
20
-
21
-
22
-
23
-
24
-
25
-
26
-
27
-
28
-
29
-
30
-
31
-
32
-
33
-
34
-
35
-
36
-
37
-
38
-
39
-
40
-
41
-
42
-
43
-
44
-
45
-
46
-
47
-
48
-
49
-
50
-
51
-
52
-
53
-
54
-
55
-
56
-
57
-
58
-
59
-
60
-
61
-
62
-
63
-
64
-
65
-
66
-
67
-
68
-
69
-
70
-
71
-
72
-
73
-
74
-
75
-
76
-
77
-
78
-
79
-
80
-
81
-
82
-
83
-
84
-
85
-
86
-
87
-
88
-
89
-
90
-
91
-
92
-
93
-
94
-
95
-
96
-
97
-
98
-
99
-
100
-
101
-
102
-
103
-
104
-
105
-
106
-
107
-
108
-
109
-
110
-
111
-
112
-
113
-
114
-
115
-
116
-
117
-
118
-
119
-
120
-
121
-
122
-
123
-
124
-
125
-
126
-
127
-
128
-
129
-
130
-
131
-
132
-
133
-
134
-
135
-
136
-
137
-
138
-
139
-
140
-
141
-
142
-
143
-
144
-
145
-
146
-
147
-
148
-
149
-
150
-
151
-
152
-
153
-
154
-
155
-
156
-
157
-
158
-
159
-
160
-
161
-
162
-
163
-
164
-
165
-
166
-
167
-
168
-
169
-
170
-
171
-
172
-
173
-
174
-
175
-
176
-
177
-
178
-
179
-
180
 |
 |

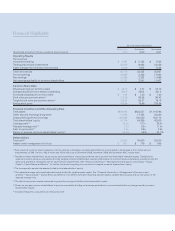
As of or for the Year Ended
($ and share amounts in millions, except per share amounts)
December
2009
November
2008
November
2007
Operating Results
Net revenues
Investment banking $ 4,797 $ 5,185 $ 7,555
Trading and principal investments 34,373 9,063 31,226
Asset management and securities services 6,003 7,974 7,206
Total net revenues 45,173 22,222 45,987
Pre-tax earnings 19,829 2,336 17,604
Net earnings 13,385 2,322 11,599
Net earnings applicable to common shareholders 12,192 2,041 11,407
Common Share Data
Diluted earnings per common share $ 22.13 $ 4.47 $ 24.73
Average diluted common shares outstanding 550.9 456.2 461.2
Dividends declared per common share $ 1.05 $ 1.40 $ 1.40
Book value per common share (1) 117.48 98.68 90.43
Tangible book value per common share (2) 108.42 88.27 79.16
Ending stock price 168.84 78.99 226.64
Financial Condition and Other Operating Data
Total assets $ 848,942 $ 884,547 $ 1,119,796
Other secured nancings (long-term) 11,203 17,458 33,300
Unsecured long-term borrowings 185,085 168,220 164,174
Total shareholders’ equity 70,714 64,369 42,800
Leverage ratio (3) 12.0x 13.7x 26.2x
Adjusted leverage ratio (4) 7.7x 8.2x 17.4x
Debt to equity ratio (5) 2.6x 2.6x 3.8x
Return on average common shareholders’ equity (6) 22.5% 4.9% 32.7%
Selected Data
Total staff (7) 32,500 34,500 35,500
Assets under management (in billions) $ 871 $ 779 $ 868
(1) Book value per common share is based on common shares outstanding, including restricted stock units granted to employees with no future service
requirements, of 542.7 million, 485.4 million and 439.0 million as of December 2009, November 2008 and November 2007, respectively.
(2) Tangible common shareholders’ equity equals total shareholders’ equity less preferred stock, goodwill and identi able intangible assets. Tangible book
value per common share is computed by dividing tangible common shareholders’ equity by the number of common shares outstanding, including restricted
stock units granted to employees with no future service requirements. See “Financial Information — Management’s Discussion and Analysis — Equity
Capital — Capital Ratios and Metrics” for further information regarding our calculation of tangible common shareholders’ equity.
(3) The leverage ratio equals total assets divided by total shareholders’ equity.
(4) The adjusted leverage ratio equals adjusted assets divided by tangible equity capital. See “Financial Information — Management’s Discussion and
Analysis — Equity Capital — Capital Ratios and Metrics” for further information regarding adjusted assets, tangible equity capital and our calculation of the
adjusted leverage ratio.
(5) The debt to equity ratio equals unsecured long-term borrowings divided by total shareholders’ equity.
(6) Return on average common shareholders’ equity is computed by dividing net earnings applicable to common shareholders by average monthly common
shareholders’ equity.
(7) Includes employees, consultants and temporary staff.
Financial Highlights