Food Lion 2005 Annual Report Download - page 69
Download and view the complete annual report
Please find page 69 of the 2005 Food Lion annual report below. You can navigate through the pages in the report by either clicking on the pages listed below, or by using the keyword search tool below to find specific information within the annual report.-
 1
1 -
2
-
3
-
4
-
5
-
6
-
7
-
8
-
9
-
10
-
11
-
12
-
13
-
14
-
15
-
16
-
17
-
18
-
19
-
20
-
21
-
22
-
23
-
24
-
25
-
26
-
27
-
28
-
29
-
30
-
31
-
32
-
33
-
34
-
35
-
36
-
37
-
38
-
39
-
40
-
41
-
42
-
43
-
44
-
45
-
46
-
47
-
48
-
49
-
50
-
51
-
52
-
53
-
54
-
55
-
56
-
57
-
58
-
 59
59 -
 60
60 -
 61
61 -
 62
62 -
 63
63 -
 64
64 -
 65
65 -
 66
66 -
 67
67 -
 68
68 -
 69
69 -
 70
70 -
 71
71 -
 72
72 -
 73
73 -
 74
74 -
 75
75 -
 76
76 -
 77
77 -
 78
78 -
 79
79 -
80
-
81
-
82
-
83
-
84
-
85
-
86
-
87
-
88
-
89
-
90
-
91
-
92
-
93
-
94
-
95
-
96
-
97
-
98
-
99
-
100
-
101
-
102
-
103
-
104
-
105
-
106
-
107
-
108
 |
 |

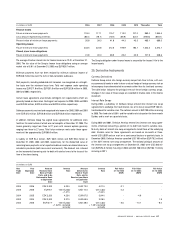
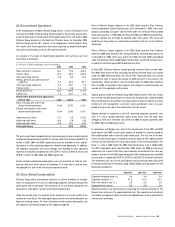
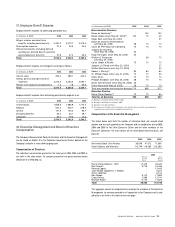
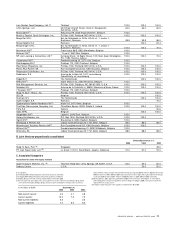
The following is a reconciliation of Delhaize Group’s Belgian statutory income tax
rate with Delhaize Group’s effective income tax rate:
(in m illions of EUR) 2005 2004 2003
Belgian statutory income tax rate 34.0% 34.0% 34.0%
Items affecting the Belgian statutory
income tax rate:
Taxation in juridictions outside Belgium:
(primarily due to United States
federal and state income tax rates
applied to the income of Delhaize
America)
(1) (2) (3)
3.9
3.5 6.4
Not taxable income (2.1) (1.9) (2.2)
Effect of unrecognized tax
losses and tax credits 0.9 1.0 1.4
Tax charges on dividend income 0.7 0.3 0.1
Change in enacted rate
(4)
-
(0.5) -
Other 0.1 0.7 (0.5)
Effective tax rate 37.5% 37.1% 39.2%
(1) In 2005, approximately 77% of Delhaize Group’s consolidated profit before tax was attributable to Delhaize
America, which had an effective tax rate of 39.0%.
(2) In 2004, approximately 71% of Delhaize Group’s consolidated profit before tax was attributable to Delhaize
America, which had an effective tax rate of 38.9%.
(3) In 2003, approximately 72% of Delhaize Group’s consolidated profit before tax was attributable to Delhaize
America, which had an effective tax rate of 42.9%.
(4) The Greek statutory tax rate was changed from 35% to 32% for fiscal year 2005, 29% for fiscal year 2006
and 25% for fiscal years starting 2007.
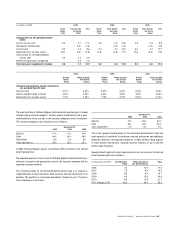
The amount of current and deferred tax charged or (credited) directly to equity
is as follows:
(in m illions of EUR) 2005 2004 2003
Current tax (6.5) (6.1) -
Deferred tax 7.6 10.7 1.6
Total tax charged directly to equity 1.1 4.6 1.6
Delhaize Group has not recognized income taxes on undistributed earnings of
certain subsidiaries as the undistributed earnings are permanently reinvested.
The cumulative amount of undistributed earnings on which Delhaize Group has
not recognized income taxes was approximately EUR 1.7 billion, EUR 1.4 billion
and EUR 1.4 billion at December 31, 2005, 2004 and 2003, respectively.
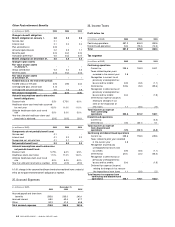
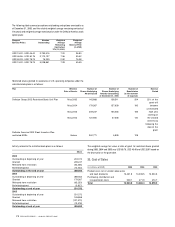
Deferred income tax assets and liabilities are offset when there is a legally
enforceable right to offset and when the deferred income taxes relate to the
same fiscal authority. Deferred income taxes recognized on the balance sheet
are as follows:
(in m illions of EUR) December 31,
2005 2004 2003
Deferred tax liabilities 253.1 240.6 223.6
Deferred tax assets 5.1 5.5 6.5
Net deferred tax liabilities 248.0 235.1 217.1
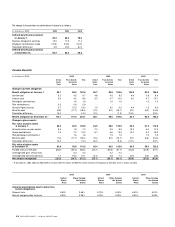
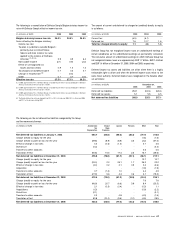
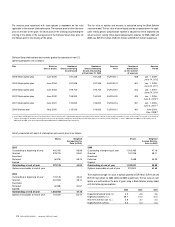
The following are the net deferred tax liabilities recognized by the Group
and the movements thereon:
(in millions of EUR)
Accelerated Closed Leases Pension Other Total
Tax Store
Depreciation Provision
Net deferred tax liabilities at January 1, 2003 603.7 (85.8) (99.2) (28.2) (77.7) 312.8
Charge (credit) to equity for the year - - - - (1.6) (1.6)
Charge (credit) to profit or loss for the year (39.8) (8.9) (8.9) 3.5 (3.2) (57.3)
Effect of change in tax rates 4.0 (0.6) (1.0) - 0.1 2.5
Divestiture (0.3) - - - - (0.3)
Transfers to other accounts - - - - 0.6 0.6
Translation effect (90.8) 15.5 17.4 2.6 15.7 (39.6)
Net deferred tax liabilities at December 31, 2003 476.8 (79.8) (91.7) (22.1) (66.1) 217.1
Charge (credit) to equity for the year - - - - 10.7 10.7
Charge (credit) to profit or loss for the year (33.0) 2.2 25.1 1.7 26.2 22.2
Effect of change in tax rates (4.0) 0.2 0.1 0.9 0.2 (2.6)
Acquisition - - - - (1.9) (1.9)
Transfers to other accounts 0.7 (1.2) 1.0 - 4.4 4.9
Translation effect (27.9) 5.6 4.3 0.6 2.1 (15.3)
Net deferred tax liabilities at December 31, 2004 412.6 (73.0) (61.2) (18.9) (24.4) 235.1
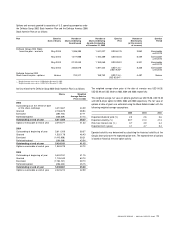
Charge (credit) to equity for the year - - - - 7.6 7.6
Charge (credit) to profit or loss for the year (46.9) 20.7 (6.6) 3.9 8.4 (20.5)
Effect of change in tax rates 2.1 (0.3) (0.4) - (0.3) 1.1
Acquisitions (1.3) - - - (0.9) (2.2)
Divestiture (0.1) - - - - (0.1)
Transfers to other accounts 2.0 - 0.8 - (4.3) (1.5)
Translation effect 53.8 (10.0) (9.6) (1.2) (4.5) 28.5
Net deferred tax liabilities at December 31, 2005 422.2 (62.6) (77.0) (16.2) (18.4) 248.0
DELHAIZE GROUP / ANNUAL REPORT 200 5 67