Food Lion 2005 Annual Report Download - page 67
Download and view the complete annual report
Please find page 67 of the 2005 Food Lion annual report below. You can navigate through the pages in the report by either clicking on the pages listed below, or by using the keyword search tool below to find specific information within the annual report.-
 1
1 -
2
-
3
-
4
-
5
-
6
-
7
-
8
-
9
-
10
-
11
-
12
-
13
-
14
-
15
-
16
-
17
-
18
-
19
-
20
-
21
-
22
-
23
-
24
-
25
-
26
-
27
-
28
-
29
-
30
-
31
-
32
-
33
-
34
-
35
-
36
-
37
-
38
-
39
-
40
-
41
-
42
-
43
-
44
-
45
-
46
-
47
-
48
-
49
-
50
-
51
-
52
-
53
-
54
-
55
-
56
-
 57
57 -
 58
58 -
 59
59 -
 60
60 -
 61
61 -
 62
62 -
 63
63 -
 64
64 -
 65
65 -
 66
66 -
 67
67 -
 68
68 -
 69
69 -
 70
70 -
 71
71 -
 72
72 -
 73
73 -
 74
74 -
 75
75 -
 76
76 -
 77
77 -
78
-
79
-
80
-
81
-
82
-
83
-
84
-
85
-
86
-
87
-
88
-
89
-
90
-
91
-
92
-
93
-
94
-
95
-
96
-
97
-
98
-
99
-
100
-
101
-
102
-
103
-
104
-
105
-
106
-
107
-
108
 |
 |

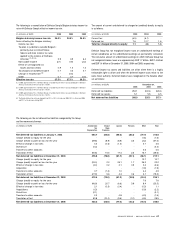
(in millions of EUR)
2005 2004 2003
United Plans Outside Total United Plans Outside Total United Plans Outside Total
States the United States the United States the United
Plans States Plans States Plans States
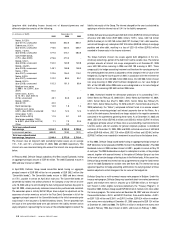
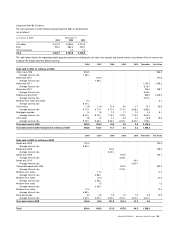
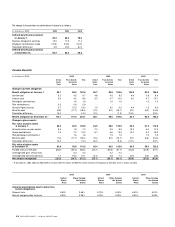
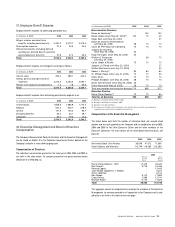
Components of net periodic benefit
costs:
Current service cost 5.2 6.1 11.3 4.8 6.0 10.8 4.6 5.3 9.9
Participants contributions - (1.6) (1.6) - (1.5) (1.5) - (1.5) (1.5)
Interest cost 5.4 4.2 9.6 5.3 4.7 10.0 6.0 4.7 10.7
Expected return on plan assets (5.5) (2.3) (7.8) (4.9) (2.8) (7.7) (5.4) (2.5) (7.9)
Amortization of unrecognized past
service cost 0.5 0.4 0.9 - - - - - -
Settlement (gain)/loss recognized - 0.3 0.3 - - - - -
Total amount recognized in income
5.6 7.1 12.7 5.2 6.4 11.6 5.2 6.0 11.2
2005 2004 2003
United Plans Outside United Plans Outside United Plans Outside
States the United States the United States the United
Plans States Plans States Plans States
Actuarial assumptions used to determine
net periodic benefit cost:
Discount rate 5.75% 4.50% 6.00% 5.00% 6.50% 5.25%
Rate of compensation increase 4.50% 3.35% 4.50% 3.55% 4.50% 3.55%
Expected return on plan assets 7.75% 4.25% 7.75% 4.75% 9.00% 4.75%
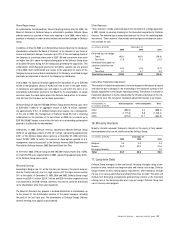
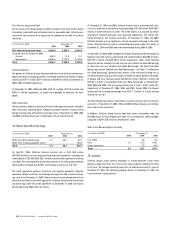
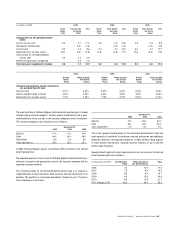
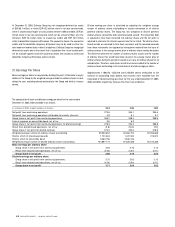
The asset portfolio of Delhaize Belgium’s defined benefit pension plan is funded
through a group insurance program. The plan assets, which benefit from a guar-
anteed minimum return, are part of the insurance company’s overall investment.
The insurance company’s asset allocation was as follows:
December 31,
2005 2004 2003
Equities 10% 12% 14%
Debt 64% 62% 58%
Real estate 8% 6% 6%
Cash equivalents 18% 20% 22%
In 2006, Delhaize Belgium expects to contribute EUR 6.2 million to the defined
benefit pension plan.
The expected long-term rate of return for Delhaize Belgium’s defined benefit pen-
sion plan is based on the guaranteed return by the insurance company and the
expected insurance dividend.
The investment policy for the Hannaford defined benefit plan is to maintain a
targeted balance of equity securities, debt securities and cash equivalents in its
portfolio. The portfolio is re-balanced periodically through the year. The plan’s
asset allocation was as follows:
December 31,
2005 2004 2003
Equities 72% 69% 64%
Debt 26% 29% 32%
Cash equivalents 2% 2% 4%
The current sponsor funding policy for the Hannaford defined benefit plan has
been generally to contribute the minimum required contribution and additional
deductible amounts at the sponsor’s discretion. In 2006, Delhaize Group expects
to make pension contributions, including voluntary amounts, of up to USD 9.0
million under this policy.
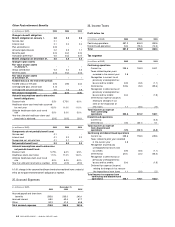
Expected benefit payments to be made during the next ten years for the defined
benefit pension plans are as follows:
(in thousands of EUR) United States Plans Outside of Total
Plans the United States
2006 7.2 10.4 17.6
2007 7.5 8.4 15.9
2008 8.3 6.4 14.7
2009 9.0 15.6 24.6
2010 8.8 12.9 21.7
2011 through 2015 49.3 34.0 83.3
DELHAIZE GROUP / ANNUAL REPORT 200 5 65