Food Lion 2002 Annual Report Download - page 53
Download and view the complete annual report
Please find page 53 of the 2002 Food Lion annual report below. You can navigate through the pages in the report by either clicking on the pages listed below, or by using the keyword search tool below to find specific information within the annual report.-
 1
1 -
2
-
3
-
4
-
5
-
6
-
7
-
8
-
9
-
10
-
11
-
12
-
13
-
14
-
15
-
16
-
17
-
18
-
19
-
20
-
21
-
22
-
23
-
24
-
25
-
26
-
27
-
28
-
29
-
30
-
31
-
32
-
33
-
34
-
35
-
36
-
37
-
38
-
39
-
40
-
41
-
42
-
 43
43 -
 44
44 -
 45
45 -
 46
46 -
 47
47 -
 48
48 -
 49
49 -
 50
50 -
 51
51 -
 52
52 -
 53
53 -
 54
54 -
 55
55 -
 56
56 -
 57
57 -
 58
58 -
 59
59 -
 60
60 -
 61
61 -
 62
62 -
 63
63 -
64
-
65
-
66
-
67
-
68
-
69
-
70
-
71
-
72
-
73
-
74
-
75
-
76
-
77
-
78
-
79
-
80
 |
 |

|51
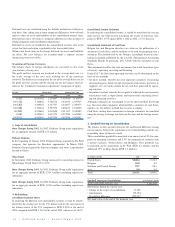
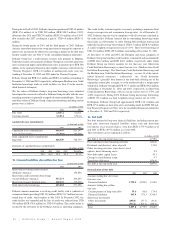
17. Contingent Liabilities
(in thousands of EUR)
Guarantees constituted or irrevocably granted
by the Group against its own assets
The guarantees represent mainly the amount of mortgages granted by
Delhaize Belgium and Delhaize America: 68,533
In addition, Delhaize America has a credit facility of USD 350 million
(approximately EUR 333.7 million), which is secured by its inventories.
Interest rate related operations
In 2001 and 2002, Delhaize America entered into interest rate swap agree-
ments to swap the fixed interest rate on a portion of its long-term debt for
variable interest rates. The aggregate notional amount is USD 300 million
(approximately EUR 286.1 million) maturing in 2006 and USD 200 mil-
lion (approximately EUR 190.7 million) maturing in 2011. The fixed rate
is 7.375% and 8.125% respectively and the variable rates are based on the
6 month or 3 month USD LIBOR.
Forward exchange agreement
Delhaize Group entered into hedging agreements related to loans and bor-
rowings and other engagements in foreign currencies.
Obligation to sell currency: 110,669
Obligation to buy currency: 109,377
Additionally, at the end of 2002, in order to hedge an intercompany receiv-
able in USD, Delhaize Group bought “Call EUR/Put USD” options which
give Delhaize Group the right to sell USD for a global amount of USD
114.8 million, with exercise prices from 1.0376 USD to 1.0422 USD for
1EUR. At the same time, Delhaize Group sold “Call USD/Put EUR”
options which give the counterparties the right to buy USD from Delhaize
group for a global amount of USD 114.8 million, with an exercise price of
1 USD for 1 EUR. The exercise date of these options is May 23, 2003.
Significant litigation and significant obligations
other than those mentioned above
Delhaize Group is from time to time involved in legal actions in the ordi-
nary course of its business. Delhaize Group is not aware of any pending or
threatened litigation, arbitration or administrative proceedings the likely
outcome of which (individually or in the aggregate) it believes is likely to
have a material adverse effect on its business, financial condition or future
results of operations. Any litigation, however, involves risk and potential-
ly significant litigation costs, and therefore Delhaize Group cannot give
any assurance that any litigation now existing or which may arise in the
future will not have a material adverse effect on its business, financial con-
dition or future results of operations.
Guaranteed debts
Debts (or parts of debts) guaranteed by mortgages or securities charges
granted or irrevocably promised on the Company’s assets
Financial debts 60,592
Non-subordinated debenture loans 60,578
Liabilities under leasing and similar contracts 14
Trade creditors 1,814
Total 62,406
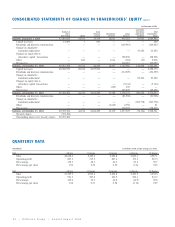
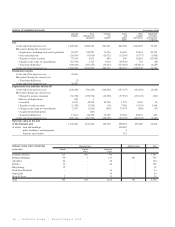
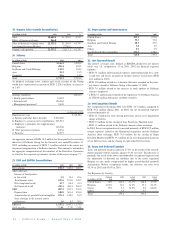
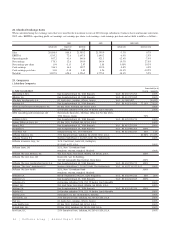
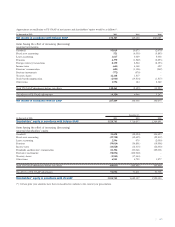
18. Geographical Overview: Contribution of Operating Companies in 2002
(in millions of EUR) United States Belgium Southern and Central Europe Asia Corporate Total
Sales 15,883.7 3,420.3 1,166.3 218.1 - 20,688.4
Cost of goods sold (11,505.7) (2,671.9) (955.0) (190.6) - (15,323.2)
Gross profit 4,378.0 748.4 211.3 27.5 - 5,365.2
Gross margin 27.6% 21.9% 18.1% 12.6% - 25.9%
Depreciation (459.1) (55.3) (28.6) (5.8) - (548.8)
Amortization (166.7) (2.6) (6.1) (0.8) - (176.2)
Salaries, miscellaneous goods and services,
other operating income/(expense) (3,053.1) (568.0) (162.5) (25.4) (24.0) (3,833.0)
Operating profit 699.1 122.5 14.1 (4.5) (24.0) 807.2
Operating margin 4.4% 3.6% 1.2% -2.1% 3.9%
Financial income/(expense) (399.0) - (16.5) 0.7 (40.3) (455.1)
Earnings before income taxes
and exceptional items 300.1 122.5 (2.4) (3.8) (64.3) 352.1
Exceptional income/(expense) (0.4) (0.6) (7.9) (2.7) (1.1) (12.7)
Earnings before income taxes 299.7 121.9 (10.3) (6.5) (65.4) 339.4
Income taxes (144.9) (30.0) (5.8) (0.1) 21.2 (159.6)
Net earnings from consolidated companies 154.8 91.9 (16.1) (6.6) (44.2) 179.8
Share in results of companies at equity - - - - 0.1 0.1
Minority interests - - (1.0) (0.6) - (1.6)
Net earnings 154.8 91.9 (17.1) (7.2) (44.1) 178.3
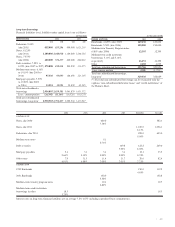
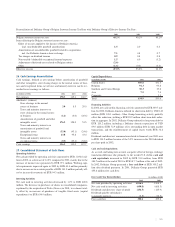
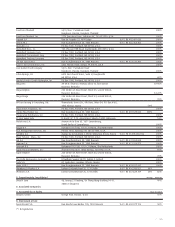
Contribution of Operating Companies
Sales Operating Profit Net Earnings
(in millions of EUR) 2002 2001 2000 %2002 2002 2001 2000 %2002 2002 2001 2000 %2002
United States EUR 15,883.7 16,905.0 14,069.5 76.8% 699.1 810.8 635.2 86.6% 154.8 137.0 84.9 86.8%
USD 15,019.6 15,140.2 12,967.3 661.1 726.2 585.5 146.4 122.7 78.4
Belgium 3,420.3 3,212.9 2,983.5 16.5% 122.5 121.5 88.4 15.2% 91.9 85.3 62.4 51.5%
Southern and Central Europe 1,166.3 1,091.0 959.4 5.6% 14.1 13.5 23.3 1.8% (17.1) (30.0) 4.0 -9.6%
Asia 218.1 187.0 155.3 1.1% (4.5) (3.4) (5.7) -0.6% (7.2) (4.3) (5.4) -4.0%
Corporate - - 0.5 - (24.0) (21.1) (1.7) -3.0% (44.1) (38.6) 14.8 -24.7%
Total 20,688.4 21,395.9 18,168.2 100.0% 807.2 921.3 739.5 100.0% 178.3 149.4 160.7 100.0%