Food Lion 2002 Annual Report Download - page 37
Download and view the complete annual report
Please find page 37 of the 2002 Food Lion annual report below. You can navigate through the pages in the report by either clicking on the pages listed below, or by using the keyword search tool below to find specific information within the annual report.-
 1
1 -
2
-
3
-
4
-
5
-
6
-
7
-
8
-
9
-
10
-
11
-
12
-
13
-
14
-
15
-
16
-
17
-
18
-
19
-
20
-
21
-
22
-
23
-
24
-
25
-
26
-
 27
27 -
 28
28 -
 29
29 -
 30
30 -
 31
31 -
 32
32 -
 33
33 -
 34
34 -
 35
35 -
 36
36 -
 37
37 -
 38
38 -
 39
39 -
 40
40 -
 41
41 -
 42
42 -
 43
43 -
 44
44 -
 45
45 -
 46
46 -
 47
47 -
48
-
49
-
50
-
51
-
52
-
53
-
54
-
55
-
56
-
57
-
58
-
59
-
60
-
61
-
62
-
63
-
64
-
65
-
66
-
67
-
68
-
69
-
70
-
71
-
72
-
73
-
74
-
75
-
76
-
77
-
78
-
79
-
80
 |
 |

|35
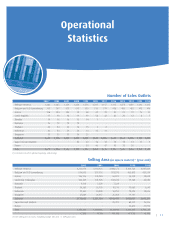
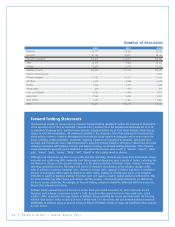
Operational
Statistics
Number of Sales Outlets
2003(1) 2002 2001 2000 1999 1998 1997 1996 1995 1994 1993 1992
Delhaize America 1,486 1,485 1,459 1,420 1,276 1,207 1,157 1,112 1,073 1,039 1,096 1,012
Belgium and G.D. Luxembourg 769 707 675 615 553 515 511 478 450 425 412 410
Greece 108 104 104 53 48 42 31 25 21 19 16 15
Czech Republic 97 93 94 99 99 58 43 30 20 12 8 7
Slovakia 14 16 16 15 14 1 - - - - - -
Romania 16 12 10 10 - - - - - - - -
Thailand 42 34 26 18 13 5 2 - - - - -
Indonesia 46 34 29 20 14 12 11 - - - - -
Singapore 39 35 31 30 25 - - - - - - -
Subtotal 2,617 2,520 2,444 2,280 2,042 1,840 1,755 1,645 1,564 1,495 1,532 1,444
Super Discount Markets - - - 30 20 18 14 13 13 13 11 9
France - - - - 50 46 47423330 --
Total 2,617 2,520 2,444 2,310 2,112 1,904 1,816 1,700 1,610 1,538 1,543 1,453
(1) Estimates based on planned openings and closings.
Selling Area (in square meters)(1) (year-end)
2002 2001 2000 1999 1998
Delhaize America 4,266,070 4,160,925 4,008,572 3,360,724 3,037,849
Belgium and G.D. Luxembourg 556,603 537,916 501,376 463,813 435,590
Greece 146,106 145,984 66,075 58,550 50,600
Czech Rep. & Slovakia 102,549 101,923 102,224 99,183 65,934
Romania 9,313 7,223 7,223 - -
Thailand 36,385 26,170 19,216 13,089 5,645
Indonesia 27,685 24,028 16,255 12,014 10,656
Singapore 27,889 26,017 25,463 19,131 -
Subtotal 5,172,600 5,030,186 4,746,404 4,026,504 3,606,274
Super Discount Markets - - 95,497 82,511 76,376
France - - - 54,810 51,995
Total 5,172,600 5,030,186 4,841,901 4,163,825 3,734,645
+2.8% +3.9% +16.3% +11.5% +8.0%
(1) Net selling area in stores, excluding storage. Net area = ± 84% gross area.