Food Lion 2002 Annual Report Download - page 40
Download and view the complete annual report
Please find page 40 of the 2002 Food Lion annual report below. You can navigate through the pages in the report by either clicking on the pages listed below, or by using the keyword search tool below to find specific information within the annual report.-
 1
1 -
2
-
3
-
4
-
5
-
6
-
7
-
8
-
9
-
10
-
11
-
12
-
13
-
14
-
15
-
16
-
17
-
18
-
19
-
20
-
21
-
22
-
23
-
24
-
25
-
26
-
27
-
28
-
29
-
 30
30 -
 31
31 -
 32
32 -
 33
33 -
 34
34 -
 35
35 -
 36
36 -
 37
37 -
 38
38 -
 39
39 -
 40
40 -
 41
41 -
 42
42 -
 43
43 -
 44
44 -
 45
45 -
 46
46 -
 47
47 -
 48
48 -
 49
49 -
 50
50 -
51
-
52
-
53
-
54
-
55
-
56
-
57
-
58
-
59
-
60
-
61
-
62
-
63
-
64
-
65
-
66
-
67
-
68
-
69
-
70
-
71
-
72
-
73
-
74
-
75
-
76
-
77
-
78
-
79
-
80
 |
 |

38 |Delhaize Group |Annual Report 2002
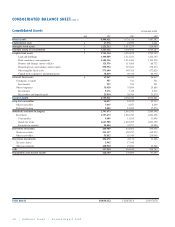
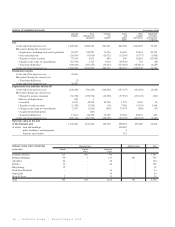
CONSOLIDATED BALANCE SHEET (note 1)
Consolidated Assets (in thousands of EUR)
Note 2002 2001 2000
Fixed assets 8,080,611 9,135,116 7,487,397
Establishment costs 417,376 24,599 3,641
Intangible fixed assets 31,121,212 1,413,279 614,963
Goodwill arising on consolidation 23,163,132 3,445,945 3,050,227
Tangible fixed assets 53,743,324 4,216,878 3,792,149
Land and buildings 1,300,489 1,412,251 1,226,155
Plant, machinery and equipment 1,104,226 1,214,484 1,163,578
Fixtures and fittings, motor vehicles 125,576 113,405 88,732
Financing leases and similar contract rights 598,994 727,641 578,514
Other tangible fixed assets 575,600 699,765 672,825
Capital work in progress and prepayments 38,439 49,332 62,345
Financial fixed assets 635,567 34,415 26,417
Companies at equity 557 531 531
Investments 557 531 531
Other companies 35,010 33,884 25,886
Investments 9,176 7,115 2,511
Receivables and deposits paid 25,834 26,769 23,375
Current assets 2,759,521 2,950,700 2,910,281
Long-term receivables 16,837 21,159 25,313
Other receivables 7,035 6,077 8,239
Deferred taxation 9,802 15,082 17,074
Inventories and work in progress 1,707,673 1,861,741 1,864,398
Inventories 1,707,673 1,861,741 1,864,398
Consumables 9,689 11,165 11,695
Goods for resale 1,667,580 1,819,299 1,833,199
Payments to account 30,404 31,277 19,504
Short-term receivables 486,989 522,602 655,938
Trade receivables 431,137 459,257 435,973
Other receivables 55,852 63,345 219,965
Short-term investments 106,472 45,139 33,388
Treasury shares 5,942 17,445 -
Other investments 100,530 27,694 33,388
Cash 317,210 364,160 239,747
Prepayments and accrued income 124,340 135,899 91,497
Total assets 10,840,132 12,085,816 10,397,678