Food Lion 2002 Annual Report Download - page 20
Download and view the complete annual report
Please find page 20 of the 2002 Food Lion annual report below. You can navigate through the pages in the report by either clicking on the pages listed below, or by using the keyword search tool below to find specific information within the annual report.-
 1
1 -
2
-
3
-
4
-
5
-
6
-
7
-
8
-
9
-
 10
10 -
 11
11 -
 12
12 -
 13
13 -
 14
14 -
 15
15 -
 16
16 -
 17
17 -
 18
18 -
 19
19 -
 20
20 -
 21
21 -
 22
22 -
 23
23 -
 24
24 -
 25
25 -
 26
26 -
 27
27 -
 28
28 -
 29
29 -
 30
30 -
31
-
32
-
33
-
34
-
35
-
36
-
37
-
38
-
39
-
40
-
41
-
42
-
43
-
44
-
45
-
46
-
47
-
48
-
49
-
50
-
51
-
52
-
53
-
54
-
55
-
56
-
57
-
58
-
59
-
60
-
61
-
62
-
63
-
64
-
65
-
66
-
67
-
68
-
69
-
70
-
71
-
72
-
73
-
74
-
75
-
76
-
77
-
78
-
79
-
80
 |
 |

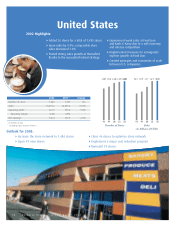
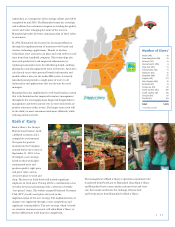
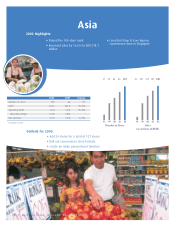
United States
18 |Delhaize Group | Annual Report 2002
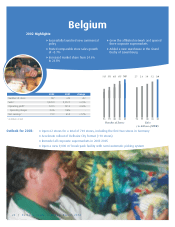
Added 26 stores for a total of 1,485 stores
Grew sales by 0.9%; comparable store
sales decreased 1.0%
Posted strong sales growth at Hannaford
thanks to the successful Festival strategy
Experienced weak sales at Food Lion
and Kash n’ Karry due to a soft economy
and intense competition
Implemented measures to reinvigorate
top-line growth at Food Lion
Created synergies and economies of scale
between U.S. companies
2002 Highlights:
Outlook for 2003:
Increase the store network to 1,486 stores Close 46 stores to optimize store network
Open 47 new stores Implement a major cost reduction program
Remodel 74 stores
Number of Stores
1,207 1,276 1,420 1,459 1,485
98 99 00 01 02
Sales
(in billions of USD)
10.2 10.9 12.7 14.9 15.0
98 99 00 01 02
2002 2001** change
Number of stores 1,485 1,459 +26
Sales* 15,019.6 14,890.4 +0.9%
Operating profit* 661.1 731.0 -9.6%
Operating margin 4.4% 4.9% -
Net earnings* 146.4 157.3 -6.9%
* in millions of USD
** excluding Super Discount Markets