Fannie Mae 2003 Annual Report Download - page 15
Download and view the complete annual report
Please find page 15 of the 2003 Fannie Mae annual report below. You can navigate through the pages in the report by either clicking on the pages listed below, or by using the keyword search tool below to find specific information within the annual report.-
 1
1 -
2
-
3
-
4
-
 5
5 -
 6
6 -
 7
7 -
 8
8 -
 9
9 -
 10
10 -
 11
11 -
 12
12 -
 13
13 -
 14
14 -
 15
15 -
 16
16 -
 17
17 -
 18
18 -
 19
19 -
 20
20 -
 21
21 -
 22
22 -
 23
23 -
 24
24 -
 25
25 -
26
-
27
-
28
-
29
-
30
-
31
-
32
-
33
-
34
-
35
 |
 |

SHAREHOLDER VALUE
13
FANNIE MAE 2003 ANNUAL REPORT
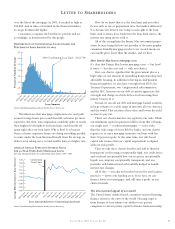
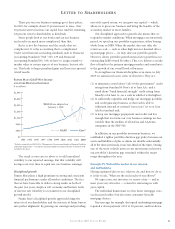
Our core net interest income has grown at an annualized rate
of 15.3 percent during the past decade. In 2003, core net
interest income grew by almost 20 percent to $10.5 billion.
This increase was driven by a five basis point increase in
Fannie Mae’s net interest margin to 1.20 percent and a rise in
the company’s average net investment balance.
The Drivers of Our Core Business Earnings*
Our guaranty fee income has grown at an annualized rate of
9.6 percent during the past decade. In 2003, guaranty fee
income rose 32.8 percent to $2.4 billion. The increase was
driven by a rise in the average effective guaranty rate and
significant growth in average outstanding MBS. In 2003,
Fannie Mae’s average effective guaranty fee rate was
20.2 basis points.
Credit-related losses remained at historically low levels in 2003,
as interest rates remained low and U.S. economic growth
improved. Losses in 2003 totaled $123 million, nearly
one-half the total 10 years earlier thanks to the strength of
the housing market, our efficient loss mitigation process,
and extensive use of credit enhancements to share credit risk.
As a percentage of the average mortgage credit book of
business, credit-related losses were 0.6 basis points in 2003.
*Our core business measures are non-GAAP (generally accepted accounting principles) financial measures
we use to evaluate our performance. See “Management’s Discussion and Analysis of Financial Condition
and Results of Operations — Core Business Earnings and Business Segment Results” in the Form 10-K
included in this report for more information about these measures.