Fannie Mae 2003 Annual Report Download - page 11
Download and view the complete annual report
Please find page 11 of the 2003 Fannie Mae annual report below. You can navigate through the pages in the report by either clicking on the pages listed below, or by using the keyword search tool below to find specific information within the annual report.-
 1
1 -
 2
2 -
 3
3 -
 4
4 -
 5
5 -
 6
6 -
 7
7 -
 8
8 -
 9
9 -
 10
10 -
 11
11 -
 12
12 -
 13
13 -
 14
14 -
 15
15 -
 16
16 -
 17
17 -
 18
18 -
 19
19 -
 20
20 -
 21
21 -
 22
22 -
23
-
24
-
25
-
26
-
27
-
28
-
29
-
30
-
31
-
32
-
33
-
34
-
35
 |
 |

9
FANNIE MAE 2003 ANNUAL REPORT
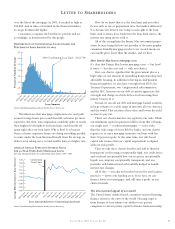
Those pre-tax core business earnings go to three places.
In 2003, for example, about 25 percent went to taxes. Over
56 percent went to increase our capital base. And the remaining
18 percent went to shareholders as dividends.
Some people look at our books and say our business
and results are much more complicated than that.
But it is not the business and the results that are
complicated. It is the accounting that is complicated.
Under new financial accounting standards such as Financial
Accounting Standard (“FAS”) No. 133 and Financial
Accounting Standard No. 149, we have to assign a mark-to-
market value to certain aspects of our business, but not oth-
ers. This leads to large unrealized gains and losses in reported
GAAP results.
The result as you can see above is to add unrealized
volatility to our reported earnings. But that volatility still
averages out over time to equal our core business earnings.
Disciplined growth
Fannie Mae places a high premium on strong and consistent
financial performance under all market conditions. The fact
that we have been able to deliver strong results in both of
the past two years, despite a soft economy and historic levels
of interest rate volatility is a testament to our disciplined
growth model.
Fannie Mae’s disciplined growth approach brings the
interests of our shareholders and the interests of home buyers
into perfect alignment. By growing our earnings and providing
you with a good return, we can grow our capital — which
allows us to grow our business and bring the benefits of the
secondary market to more families.
Our disciplined approach to growth also means that we
respond to market conditions. When mortgages are attractively
priced, we speed up our portfolio acquisitions, either buying
whole loans or MBS. When the market does not offer the
return we seek — such as when high investor demand drives
up mortgage prices — we may slow our portfolio growth.
However, slower portfolio growth means faster growth in our
outstanding MBS owned by others. This, too, delivers a steady
flow of funds to the primary mortgage market and contributes
to the growth of our overall book of business.
To strengthen our financial discipline even more, in July
2003 we announced a new series of objectives. They are:
(1) to maintain a stand-alone “risk-to-the-government” credit
rating from Standard & Poor’s of at least AA-, and a
stand-alone “bank financial strength” credit rating from
Moody’s of at least A-, on a scale in which A is the highest;
(2) to sufficiently capitalize and hedge our mortgage portfolio
and credit guaranty business so that each is able to
withstand internal or external “stress tests” set to at least
AA/Aa standard; and,
(3) to keep our mortgage prepayment and credit risk low
enough that over time our core business earnings are less
variable than the median of all AA/Aa and AAA/Aaa
companies in the S&P 500.
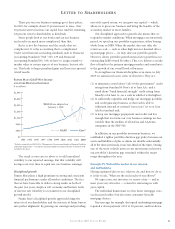
In addition, in our portfolio investment business, we
established a tighter portfolio duration gap policy between our
assets and liabilities of plus or minus six months substantially
all of the time (previously, it was two-thirds of the time). During
one of the most volatile interest rate movements in history,
our portfolio’s duration gap remained within the target
range throughout the year.
Principle IV: We lead the market in our mission
and our business
Having explained who we are, what we do, and how we do it,
it is fair to ask, “What are the end results of our efforts?”
We expect you, our investors, to receive a fair — and in
most years very attractive — return for entrusting us with
your capital.
The individual homeowner receives lower mortgage costs
(as discussed earlier) but also more consumer-friendly
mortgage choices.
Ten years ago, for example, the typical conforming mortgage
required a down payment of 10 to 20 percent, and low-down
LETTER TO SHAREHOLDERS
*Excludes certain effects of FAS 133.See “Management’s Discussion and Analysis of Financial Condition
and Results of Operations — Core Business Earnings and Business Segment Results” in the Form 10-K
included in this report.