Family Dollar 2012 Annual Report Download - page 70
Download and view the complete annual report
Please find page 70 of the 2012 Family Dollar annual report below. You can navigate through the pages in the report by either clicking on the pages listed below, or by using the keyword search tool below to find specific information within the annual report.-
 1
1 -
2
-
3
-
4
-
5
-
6
-
7
-
8
-
9
-
10
-
11
-
12
-
13
-
14
-
15
-
16
-
17
-
18
-
19
-
20
-
21
-
22
-
23
-
24
-
25
-
26
-
27
-
28
-
29
-
30
-
31
-
32
-
33
-
34
-
35
-
36
-
37
-
38
-
39
-
40
-
41
-
42
-
43
-
44
-
45
-
46
-
47
-
48
-
49
-
50
-
51
-
52
-
53
-
54
-
55
-
56
-
57
-
58
-
59
-
 60
60 -
 61
61 -
 62
62 -
 63
63 -
 64
64 -
 65
65 -
 66
66 -
 67
67 -
 68
68 -
 69
69 -
 70
70 -
 71
71 -
 72
72 -
 73
73 -
 74
74 -
 75
75 -
 76
76 -
 77
77 -
 78
78 -
 79
79 -
 80
80 -
81
-
82
-
83
-
84
 |
 |

The following table describes the Company’s product categories in more detail:
Consumables ............. Household chemicals
Paper products
Food
Health and beauty aids
Hardware and automotive supplies
Pet food and supplies
Tobacco
Home Products ........... Domestics, including blankets, sheets and towels
Housewares
Giftware
Home décor
Apparel and Accessories . . . Men’s clothing
Women’s clothing
Boys’ and girls’ clothing
Infants’ clothing
Shoes
Fashion accessories
Seasonal and Electronics . . . Toys
Stationery and school supplies
Seasonal goods
Personal electronics, including pre-paid cellular phones and services
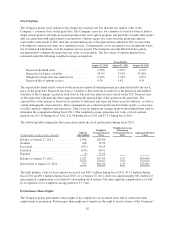
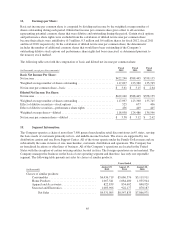
16. Unaudited Summaries of Quarterly Results:
(in thousands, except per share amounts)
First
Quarter
Second
Quarter
Third
Quarter
Fourth
Quarter
2012
Net sales ....................................... $2,148,287 $2,458,636 $2,359,957 $2,364,125
Gross profit ..................................... 757,572 857,399 845,273 799,703
Net income ..................................... 80,350 136,419 124,540 80,931
Net income per common share(1) ..................... 0.68 1.15 1.06 0.69
2011
Net sales ....................................... $1,996,941 $2,263,169 $2,153,395 $2,134,330
Gross profit ..................................... 719,565 807,367 779,756 725,607
Net income ..................................... 74,315 123,180 111,101 79,849
Net income per common share(1) ..................... 0.58 0.98 0.91 0.66
(1) Figures represent diluted earnings per share. The sum of the quarterly net income per common share may
not equal the annual net income per common share due to rounding.
17. Related Party Transactions:
There were no material related party transactions during fiscal 2012, fiscal 2011 or fiscal 2010.
66