Family Dollar 2012 Annual Report Download - page 54
Download and view the complete annual report
Please find page 54 of the 2012 Family Dollar annual report below. You can navigate through the pages in the report by either clicking on the pages listed below, or by using the keyword search tool below to find specific information within the annual report.-
 1
1 -
2
-
3
-
4
-
5
-
6
-
7
-
8
-
9
-
10
-
11
-
12
-
13
-
14
-
15
-
16
-
17
-
18
-
19
-
20
-
21
-
22
-
23
-
24
-
25
-
26
-
27
-
28
-
29
-
30
-
31
-
32
-
33
-
34
-
35
-
36
-
37
-
38
-
39
-
40
-
41
-
42
-
43
-
 44
44 -
 45
45 -
 46
46 -
 47
47 -
 48
48 -
 49
49 -
 50
50 -
 51
51 -
 52
52 -
 53
53 -
 54
54 -
 55
55 -
 56
56 -
 57
57 -
 58
58 -
 59
59 -
 60
60 -
 61
61 -
 62
62 -
 63
63 -
 64
64 -
65
-
66
-
67
-
68
-
69
-
70
-
71
-
72
-
73
-
74
-
75
-
76
-
77
-
78
-
79
-
80
-
81
-
82
-
83
-
84
 |
 |

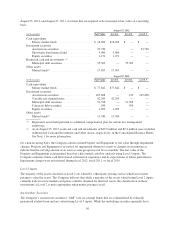
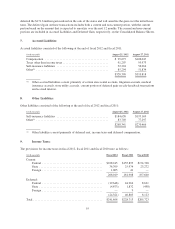
August 25, 2012, and August 27, 2011, for items that are required to be measured at fair value on a recurring
basis:
August 25, 2012
(in thousands) Fair Value Level 1 Level 2 Level 3
Cash equivalents:
Money market funds ...................... $ 18,902 $18,902 $ — $ —
Investment securities:
Auction rate securities ..................... 23,720 — — 23,720
Short-term bond mutual fund ............... 5,000 5,000 — —
Equity securities ......................... 1,271 1,271 — —
Restricted cash and investments: (2)
Municipal debt securities .................. 55,303 — 55,303 —
Other assets:
Mutual funds(1) .......................... 17,903 17,903 — —
August 27, 2011
(in thousands) Fair Value Level 1 Level 2 Level 3
Cash equivalents:
Money market funds ...................... $ 77,842 $77,842 $ — $ —
Investment securities:
Auction rate securities ..................... 107,608 — 150 107,458
Variable rate demand notes ................. 42,299 42,299 — —
Municipal debt securities .................. 51,398 — 51,398 —
Corporate debt securities ................... 950 — 950 —
Equity securities ......................... 1,209 1,209 — —
Other assets:
Mutual funds(1) .......................... 15,580 15,580 — —
(1) Represents assets held pursuant to a deferred compensation plan for certain key management
employees.
(2) As of August 25, 2012, restricted cash and investments of $45.9 million and $9.4 million were included
in Restricted Cash and Investments and Other Assets, respectively, in the Consolidated Balance Sheets.
See Note 1 for more information.
On a non-recurring basis, the Company adjusts certain Property and Equipment to fair value through impairment
charges. Property and Equipment is reviewed for impairment whenever events or changes in circumstances
indicate that the carrying amount of an asset or asset group may not be recoverable. The fair value of the
Property and Equipment is determined based on a discounted cash flow analysis using Level 3 inputs. The
Company estimates future cash flows based on historical experience and its expectations of future performance.
Impairment charges were not material during fiscal 2012, fiscal 2011, or fiscal 2010.
Level 2 Inputs
The majority of the assets classified as Level 2 are valued by a third-party pricing service which uses matrix
pricing to value the assets. The Company believes that while a majority of the assets valued using Level 2 inputs
currently trade in active markets and prices could be obtained for identical assets, the classification of these
investments as Level 2 is more appropriate when matrix pricing is used.
Auction Rate Securities
The Company’s auction rate securities (“ARS”) are tax-exempt bonds that are collateralized by federally
guaranteed student loans and are valued using Level 3 inputs. While the underlying securities generally have
50