Family Dollar 2012 Annual Report Download - page 31
Download and view the complete annual report
Please find page 31 of the 2012 Family Dollar annual report below. You can navigate through the pages in the report by either clicking on the pages listed below, or by using the keyword search tool below to find specific information within the annual report.-
 1
1 -
2
-
3
-
4
-
5
-
6
-
7
-
8
-
9
-
10
-
11
-
12
-
13
-
14
-
15
-
16
-
17
-
18
-
19
-
20
-
 21
21 -
 22
22 -
 23
23 -
 24
24 -
 25
25 -
 26
26 -
 27
27 -
 28
28 -
 29
29 -
 30
30 -
 31
31 -
 32
32 -
 33
33 -
 34
34 -
 35
35 -
 36
36 -
 37
37 -
 38
38 -
 39
39 -
 40
40 -
 41
41 -
42
-
43
-
44
-
45
-
46
-
47
-
48
-
49
-
50
-
51
-
52
-
53
-
54
-
55
-
56
-
57
-
58
-
59
-
60
-
61
-
62
-
63
-
64
-
65
-
66
-
67
-
68
-
69
-
70
-
71
-
72
-
73
-
74
-
75
-
76
-
77
-
78
-
79
-
80
-
81
-
82
-
83
-
84
 |
 |

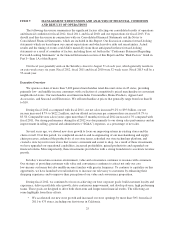
To continue to deliver profitable sales, in fiscal 2013 we plan to continue to expand our Global Sourcing
teams, develop stronger processes to help us integrate our sourcing activities with our category management
efforts, and continue to expand our supplier network. We expect these efforts will continue to increase our
profitability and help to mitigate some margin pressures.
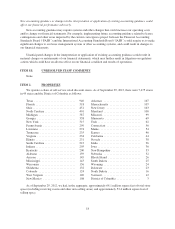
During fiscal 2013, we expect net sales to grow due to the acceleration of our new store growth and an
increase in comparable stores sales. Additionally, as noted above, fiscal 2013 is a 53-week year, as compared to a
52-week year in fiscal 2012. We expect comparable store sales to increase as a result of our current strategic
initiatives, as well as continued benefits from operational improvements over the past several years. We expect
sales will continue to be strongest in the Consumables category as customers continue to respond favorably to
our expanded merchandise selection in food and health and beauty aids as well as our introduction of tobacco
products to our stores. We believe this shift to more sales of lower margin Consumables merchandise will
pressure gross margin in fiscal 2013, as compared to fiscal 2012. However, as a result of our expectation for
increased comparable store sales, we expect selling, general and administrative expenses to leverage in fiscal
2013, as compared to fiscal 2012.
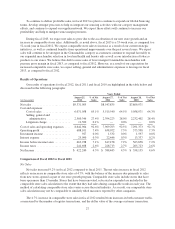
Results of Operations
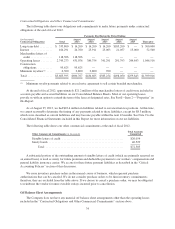
Our results of operations for fiscal 2012, fiscal 2011 and fiscal 2010 are highlighted in the table below and
discussed in the following paragraphs:
Years Ended
(in thousands)
August 25,
2012
% of Net
Sales
August 27,
2011
% of Net
Sales
August 28,
2010
% of Net
Sales
Net sales .......................... $9,331,005 $8,547,835 $7,866,971
Cost and expenses:
Cost of sales ................... 6,071,058 65.1% 5,515,540 64.5% 5,058,971 64.3%
Selling, general and
administrative ................ 2,560,346 27.4% 2,394,223 28.0% 2,232,402 28.4%
Litigation charge ................ 11,500 0.1% — 0.0% — 0.0%
Cost of sales and operating expenses .... 8,642,904 92.6% 7,909,763 92.5% 7,291,373 92.7%
Operating profit .................... 688,101 7.4% 638,072 7.5% 575,598 7.3%
Investment income .................. 927 0.0% 1,532 0.0% 1,597 0.0%
Interest expense .................... 25,090 0.3% 22,446 0.3% 13,337 0.2%
Income before income taxes ........... 663,938 7.1% 617,158 7.2% 563,858 7.2%
Income taxes ....................... 241,698 2.6% 228,713 2.7% 205,723 2.6%
Net Income ........................ $ 422,240 4.5% $ 388,445 4.5% $ 358,135 4.6%
Comparison of Fiscal 2012 to Fiscal 2011
Net Sales
Net sales increased 9.2% in fiscal 2012 compared to fiscal 2011. The net sales increase in fiscal 2012
reflects an increase in comparable store sales of 4.7%, with the balance of the increase due primarily to sales
from new stores opened as part of our store growth program. Comparable store sales include stores that have
been open more than 13 months. Stores that have been renovated, relocated or expanded are included in the
comparable store sales calculation to the extent that they had sales during comparable weeks in each year. The
method of calculating comparable store sales varies across the retail industry. As a result, our comparable store
sales calculation may not be comparable to similarly titled measures reported by other companies.
The 4.7% increase in comparable store sales in fiscal 2012 resulted from increases in both customer traffic,
as measured by the number of register transactions, and the dollar value of the average customer transaction.
27