Family Dollar 2012 Annual Report Download - page 44
Download and view the complete annual report
Please find page 44 of the 2012 Family Dollar annual report below. You can navigate through the pages in the report by either clicking on the pages listed below, or by using the keyword search tool below to find specific information within the annual report.-
 1
1 -
2
-
3
-
4
-
5
-
6
-
7
-
8
-
9
-
10
-
11
-
12
-
13
-
14
-
15
-
16
-
17
-
18
-
19
-
20
-
21
-
22
-
23
-
24
-
25
-
26
-
27
-
28
-
29
-
30
-
31
-
32
-
33
-
 34
34 -
 35
35 -
 36
36 -
 37
37 -
 38
38 -
 39
39 -
 40
40 -
 41
41 -
 42
42 -
 43
43 -
 44
44 -
 45
45 -
 46
46 -
 47
47 -
 48
48 -
 49
49 -
 50
50 -
 51
51 -
 52
52 -
 53
53 -
 54
54 -
55
-
56
-
57
-
58
-
59
-
60
-
61
-
62
-
63
-
64
-
65
-
66
-
67
-
68
-
69
-
70
-
71
-
72
-
73
-
74
-
75
-
76
-
77
-
78
-
79
-
80
-
81
-
82
-
83
-
84
 |
 |

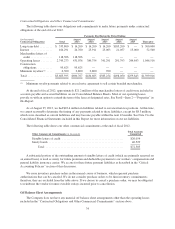
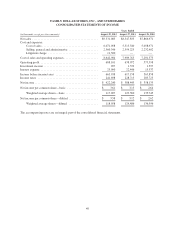
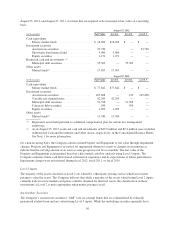
FAMILY DOLLAR STORES, INC., AND SUBSIDIARIES
CONSOLIDATED STATEMENTS OF INCOME
Years Ended
(in thousands, except per share amounts) August 25, 2012 August 27, 2011 August 28, 2010
Net sales ............................................. $9,331,005 $8,547,835 $7,866,971
Cost and expenses:
Cost of sales ...................................... 6,071,058 5,515,540 5,058,971
Selling, general and administrative .................... 2,560,346 2,394,223 2,232,402
Litigation charge .................................. 11,500 — —
Cost of sales and operating expenses ....................... 8,642,904 7,909,763 7,291,373
Operating profit ....................................... 688,101 638,072 575,598
Investment income ..................................... 927 1,532 1,597
Interest expense ....................................... 25,090 22,446 13,337
Income before income taxes ............................. 663,938 617,158 563,858
Income taxes ......................................... 241,698 228,713 205,723
Net income ........................................... $ 422,240 $ 388,445 $ 358,135
Net income per common share—basic ..................... $ 3.61 $ 3.15 $ 2.64
Weighted average shares—basic ...................... 117,097 123,360 135,745
Net income per common share—diluted .................... $ 3.58 $ 3.12 $ 2.62
Weighted average shares—diluted .................... 118,058 124,486 136,596
The accompanying notes are an integral part of the consolidated financial statements.
40