Family Dollar 2012 Annual Report Download - page 60
Download and view the complete annual report
Please find page 60 of the 2012 Family Dollar annual report below. You can navigate through the pages in the report by either clicking on the pages listed below, or by using the keyword search tool below to find specific information within the annual report.-
 1
1 -
2
-
3
-
4
-
5
-
6
-
7
-
8
-
9
-
10
-
11
-
12
-
13
-
14
-
15
-
16
-
17
-
18
-
19
-
20
-
21
-
22
-
23
-
24
-
25
-
26
-
27
-
28
-
29
-
30
-
31
-
32
-
33
-
34
-
35
-
36
-
37
-
38
-
39
-
40
-
41
-
42
-
43
-
44
-
45
-
46
-
47
-
48
-
49
-
 50
50 -
 51
51 -
 52
52 -
 53
53 -
 54
54 -
 55
55 -
 56
56 -
 57
57 -
 58
58 -
 59
59 -
 60
60 -
 61
61 -
 62
62 -
 63
63 -
 64
64 -
 65
65 -
 66
66 -
 67
67 -
 68
68 -
 69
69 -
 70
70 -
71
-
72
-
73
-
74
-
75
-
76
-
77
-
78
-
79
-
80
-
81
-
82
-
83
-
84
 |
 |

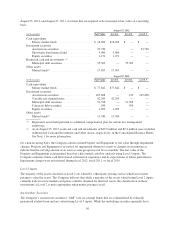
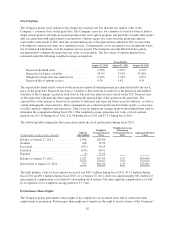
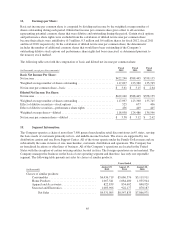
The following table summarizes the components of income tax expense in fiscal 2012, fiscal 2011 and fiscal
2010:
Fiscal 2012 Fiscal 2011 Fiscal 2010
(in thousands)
Income tax
expense
% of pre-tax
income
Income tax
expense
% of pre-tax
income
Income tax
expense
% of pre-tax
income
Computed federal income tax ...... $232,378 35.0% $216,005 35.0% $197,351 35.0%
State income taxes, net of federal
income tax benefit ............. 17,893 2.7 17,149 2.8 15,885 2.8
Valuation allowance ............. 1,732 0.3 1,566 0.3 (1,286) (0.2)
Other ......................... (10,305) (1.6) (6,007) (1.0) (6,227) (1.1)
Actual income tax expense ........ $241,698 36.4% $228,713 37.1% $205,723 36.5%
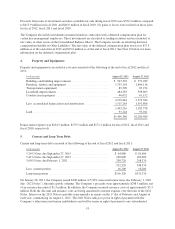
The tax effects of temporary differences that give rise to significant portions of the deferred tax assets and
deferred tax liabilities as of the end of fiscal 2012 and the end of fiscal 2011, were as follows:
(in thousands) August 25, 2012 August 27, 2011
Deferred income tax liabilities:
Excess of book over tax basis of property and equipment ..... $109,397 $124,243
Deferred income tax assets:
Excess of tax over book basis of inventories ................ $ 26,359 $ 17,372
Nondeductible accruals for:
Insurance ....................................... 12,395 13,930
Compensation ................................... 34,717 34,739
Net Operating Losses .............................. 7,123 5,148
Deferred rent .................................... 19,063 14,708
Litigation charge ................................. 4,149 151
Other .............................................. 12,594 12,965
Gross deferred income tax assets ............................. 116,400 99,013
Less: valuation allowance .................................. (5,730) (3,999)
Net deferred tax assets ..................................... $110,670 $ 95,014
The Company had state net operating loss carryforwards of $128.4 million as of August 25, 2012, and $112.4
million as of August 27, 2011, in various states. These carryforwards expire at different intervals up to fiscal year
2032. Management considers all available evidence in determining the likelihood that a deferred tax asset will
not be realized. As a result, the Company increased the valuation allowances related to these state loss
carryforwards.
The Company classifies accrued interest expense and penalties related to uncertain tax positions as a component
of income tax expense. Interest and penalties reduced income tax expense by $0.6 million in fiscal 2012,
increased income tax expense by $1.0 million in fiscal 2011, and reduced income tax expense by $1.5 million in
fiscal 2010. The decrease in fiscal 2012 relates to changes in uncertain tax positions as compared to additional
uncertain tax positions recorded during fiscal 2011 and settlements of uncertain tax positions during fiscal 2010.
56