Family Dollar 2012 Annual Report Download - page 12
Download and view the complete annual report
Please find page 12 of the 2012 Family Dollar annual report below. You can navigate through the pages in the report by either clicking on the pages listed below, or by using the keyword search tool below to find specific information within the annual report.-
 1
1 -
 2
2 -
 3
3 -
 4
4 -
 5
5 -
 6
6 -
 7
7 -
 8
8 -
 9
9 -
 10
10 -
 11
11 -
 12
12 -
 13
13 -
 14
14 -
 15
15 -
 16
16 -
 17
17 -
 18
18 -
 19
19 -
 20
20 -
 21
21 -
 22
22 -
23
-
24
-
25
-
26
-
27
-
28
-
29
-
30
-
31
-
32
-
33
-
34
-
35
-
36
-
37
-
38
-
39
-
40
-
41
-
42
-
43
-
44
-
45
-
46
-
47
-
48
-
49
-
50
-
51
-
52
-
53
-
54
-
55
-
56
-
57
-
58
-
59
-
60
-
61
-
62
-
63
-
64
-
65
-
66
-
67
-
68
-
69
-
70
-
71
-
72
-
73
-
74
-
75
-
76
-
77
-
78
-
79
-
80
-
81
-
82
-
83
-
84
 |
 |

majority of the products are priced at $10 or less, with approximately 28% priced at $1 or less. Our stores operate
on a self-service basis, and our low overhead enables us to sell merchandise at a relatively moderate markup. In
fiscal 2012, we expanded both the number of trips that our customers make as well as the amount spent during
each trip, with an average customer transaction of around $10.
Our typical store generally carries approximately 6500 – 7000 basic SKUs, with fluctuations in seasonal
items throughout the year. The number of SKUs in a given store can vary based upon the store’s size, geographic
location, merchandising initiatives, and other factors.
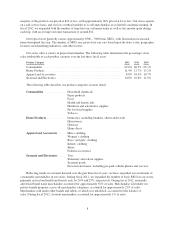
Our stores offer a variety of general merchandise. The following table summarizes the percentage of net
sales attributable to each product category over the last three fiscal years.
Product Category 2012 2011 2010
Consumables .................................................... 69.0% 66.5% 65.1%
Home Products ................................................... 11.4% 12.7% 13.2%
Apparel and Accessories ........................................... 8.8% 10.0% 10.7%
Seasonal and Electronics ........................................... 10.8% 10.8% 11.0%
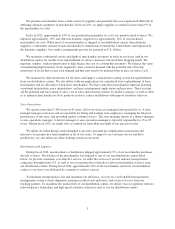
The following table describes our product categories in more detail.
Consumables .............. Household chemicals
Paper products
Food
Health and beauty aids
Hardware and automotive supplies
Pet food and supplies
Tobacco
Home Products ............ Domestics, including blankets, sheets and towels
Housewares
Giftware
Home décor
Apparel and Accessories .... Men’s clothing
Women’s clothing
Boys’ and girls’ clothing
Infants’ clothing
Shoes
Fashion accessories
Seasonal and Electronics .... Toys
Stationery and school supplies
Seasonal goods
Personal electronics, including pre-paid cellular phones and services
Reflecting trends in customer demand over the past three fiscal years, we have expanded our assortment of
consumable merchandise in our stores. During fiscal 2012, we expanded the number of basic SKUs in our stores,
primarily in food and health and beauty aids, by 20% and 25%, respectively. During fiscal 2012, nationally
advertised brand name merchandise accounted for approximately 56% of sales. Merchandise sold under our
private brands program, across all merchandise categories, accounted for approximately 25% of sales.
Merchandise sold under other brands and labels, or which was unlabeled, accounted for the balance of
sales. During fiscal 2012, closeout merchandise accounted for approximately 1% of sales.
8