Family Dollar 2012 Annual Report Download - page 67
Download and view the complete annual report
Please find page 67 of the 2012 Family Dollar annual report below. You can navigate through the pages in the report by either clicking on the pages listed below, or by using the keyword search tool below to find specific information within the annual report.-
 1
1 -
2
-
3
-
4
-
5
-
6
-
7
-
8
-
9
-
10
-
11
-
12
-
13
-
14
-
15
-
16
-
17
-
18
-
19
-
20
-
21
-
22
-
23
-
24
-
25
-
26
-
27
-
28
-
29
-
30
-
31
-
32
-
33
-
34
-
35
-
36
-
37
-
38
-
39
-
40
-
41
-
42
-
43
-
44
-
45
-
46
-
47
-
48
-
49
-
50
-
51
-
52
-
53
-
54
-
55
-
56
-
 57
57 -
 58
58 -
 59
59 -
 60
60 -
 61
61 -
 62
62 -
 63
63 -
 64
64 -
 65
65 -
 66
66 -
 67
67 -
 68
68 -
 69
69 -
 70
70 -
 71
71 -
 72
72 -
 73
73 -
 74
74 -
 75
75 -
 76
76 -
 77
77 -
78
-
79
-
80
-
81
-
82
-
83
-
84
 |
 |

common stock at a future date based on the Company’s performance relative to a peer group. Performance is
measured based on two pre-tax metrics: Return on Equity and Income Growth. The Leadership Development and
Compensation Committee of the Board of Directors establishes the peer group and performance metrics. The
performance share rights vest at the end of the performance period (generally three years) and the shares are
issued shortly thereafter. The actual number of shares issued can range from 0% to 200% of the employee’s
target award depending on the Company’s performance relative to the peer group. The following table
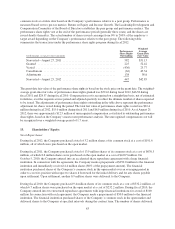
summarizes the transactions under the performance share rights program during fiscal 2012:
(in thousands, except per share amounts)
Performance
Share Rights
Outstanding
Weighted
Average
Grant-Date
Fair Value
Nonvested—August 27, 2011 .................................... 582 $31.13
Granted ..................................................... 225 52.42
Vested ...................................................... (436) 25.77
Cancellations ................................................. (62) 45.34
Adjustments .................................................. 138 N/A
Nonvested—August 25, 2012 .................................... 447 $42.85
The grant-date fair value of the performance share rights is based on the stock price on the grant date. The weighted-
average grant-date fair value of performance share rights granted was $52.42 during fiscal 2012, $46.38 during
fiscal 2011 and $28.37 during fiscal 2010. Compensation cost is recognized on a straight-line basis, net of estimated
forfeitures, over the requisite service period and adjusted quarterly to reflect the ultimate number of shares expected
to be issued. The adjustments of performance share rights outstanding in the table above represent the performance
adjustment for shares vested during the period. The total fair value of performance share rights vested was $22.4
million during fiscal 2012, $15.0 million during fiscal 2011 and $6.9 million during fiscal 2010. As of August 25,
2012, there was approximately $12.5 million of unrecognized compensation cost related to outstanding performance
share rights, based on the Company’s most recent performance analysis. The unrecognized compensation cost will
be recognized over a weighted-average period of 1.7 years.
13. Shareholders’ Equity:
Stock Repurchases
During fiscal 2012, the Company purchased a total of 3.2 million shares of its common stock at a cost of $191.6
million, all of which were purchased on the open market.
During fiscal 2011, the Company purchased a total of 13.9 million shares of its common stock at a cost of $670.5
million, of which 8.6 million shares were purchased on the open market at a cost of $420.5 million. On
October 5, 2010, the Company entered into an accelerated share repurchase agreement with a large financial
institution. In connection with the agreement, the Company made a prepayment of $250.0 million to the financial
institution and immediately received 4.4 million shares (80% of the prepayment amount). The financial
institution purchased shares of the Company’s common stock in the open market over an averaging period in
order to cover its position with respect to shares it borrowed for the initial delivery and for any shares payable
upon settlement. Upon settlement, another 0.9 million shares were delivered to the Company.
During fiscal 2010, the Company purchased 9.4 million shares of its common stock at a cost of $332.2 million, of
which 6.7 million shares were purchased on the open market at a cost of $232.2 million. During fiscal 2010, the
Company entered into two structured repurchase agreements with large financial institutions for a total of $100
million. In connection with each agreement, the Company made a prepayment of $50.0 million to the financial
institution. The financial institution purchased shares of the Company’s common stock in the open market and
delivered shares to the Company at specified intervals during the contract term. The number of shares delivered
63