Electrolux 2010 Annual Report Download - page 11
Download and view the complete annual report
Please find page 11 of the 2010 Electrolux annual report below. You can navigate through the pages in the report by either clicking on the pages listed below, or by using the keyword search tool below to find specific information within the annual report.-
 1
1 -
 2
2 -
 3
3 -
 4
4 -
 5
5 -
 6
6 -
 7
7 -
 8
8 -
 9
9 -
 10
10 -
 11
11 -
 12
12 -
 13
13 -
 14
14 -
 15
15 -
 16
16 -
 17
17 -
 18
18 -
 19
19 -
 20
20 -
 21
21 -
 22
22 -
23
-
24
-
25
-
26
-
27
-
28
-
29
-
30
-
31
-
32
-
33
-
34
-
35
-
36
-
37
-
38
-
39
-
40
-
41
-
42
-
43
-
44
-
45
-
46
-
47
-
48
-
49
-
50
-
51
-
52
-
53
-
54
-
55
-
56
-
57
-
58
-
59
-
60
-
61
-
62
-
63
-
64
-
65
-
66
-
67
-
68
-
69
-
70
-
71
-
72
-
73
-
74
-
75
-
76
-
77
-
78
-
79
-
80
-
81
-
82
-
83
-
84
-
85
-
86
-
87
-
88
-
89
-
90
-
91
-
92
-
93
-
94
-
95
-
96
-
97
-
98
-
99
-
100
-
101
-
102
-
103
-
104
-
105
-
106
-
107
-
108
-
109
-
110
-
111
-
112
-
113
-
114
-
115
-
116
-
117
-
118
-
119
-
120
-
121
-
122
-
123
-
124
-
125
-
126
-
127
-
128
-
129
-
130
-
131
-
132
-
133
-
134
-
135
-
136
-
137
-
138
-
139
-
140
-
141
-
142
-
143
-
144
-
145
-
146
-
147
-
148
-
149
-
150
-
151
-
152
-
153
-
154
-
155
-
156
-
157
-
158
-
159
-
160
-
161
-
162
-
163
-
164
-
165
-
166
-
167
-
168
-
169
-
170
-
171
-
172
-
173
-
174
-
175
-
176
-
177
-
178
-
179
-
180
-
181
-
182
-
183
-
184
-
185
-
186
-
187
-
188
-
189
-
190
-
191
-
192
-
193
-
194
-
195
-
196
-
197
-
198
 |
 |

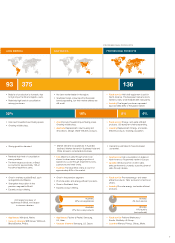
PROFESSIONAL PRODUCTS
PROFESSIONAL PRODUCTS
• Majority of production is domestic due
to high import tariffs and logistic costs.
• Relatively high level of consolidation
among producers.
• No clear market leader in the region.
• Southeast Asian consumers find European
brands appealing, but their market shares are
still small.
• Food service Half of all equipment is sold in
North America. The European market is domi-
nated by many small independent restaurants.
• Laundry Five largest producers represent
approximately 55% of the global market.
Australia,
42% core appliances
Globally,
4% food service
Australia,
21% floor-care products
Globally,
11% laundry
(own estimate)
2nd largest producer of
appliances in Brazil, and largest
in vacuum cleaners.
• Improved household purchasing power.
• Growing middle class.
• Asia Improved household purchasing power.
Growing middle class.
• Australia Replacement, new housing and
renovations. Design. Water-efficient products.
• Food service Energy- and water-efficient
products. US restaurant chains expanding.
• Laundry Replacement. Energy- and water-
efficient products. Growing population.
• Appliances Whirlpool, Mabe.
• Vacuum cleaners SEB Group, Whirlpool,
Black&Decker, Philips.
• Appliances Fischer & Paykel, Samsung,
LG, Haier.
• Vacuum cleaners Samsung, LG, Dyson.
• Food service Rational Manitowoc/
Enodis, Middleby, Ali Group.
• Laundry Alliance, Primus, Girbau, Miele.
• Grow in markets outside Brazil, such
as Argentina and Mexico.
• Strengthen the position in the
premium segment in Brazil.
• Expand product offering.
• Grow in the premium segment.
• Promote water- and energy-efficient products.
• Grow in Southeast Asia.
• Expand product offering.
• Food service Promote energy- and water-
efficient products. Tailor products for fast-food
chains.
• Laundry Promote energy- and water-efficient
products.
ASIA/PACIFICLATIN AMERICA
• Strong growth in demand. • Market demand for appliances in Australia
declined. Market demand in Southeast Asia and
China showed a considerable increase.
• Demand is estimated to have increased
somewhat.
• Relatively high level of consolidation
among retailers.
• The three largest producers in Brazil
accounted for approximately 75% of
household appliances sales.
• Asia Majority of sales through small, local
stores. In urban areas, a large proportion of
appliances is sold through department stores,
superstores and retail chains.
• Australia Five large retail chains account for
approximately 90% of the market.
• Food service High consolidation of dealers in
North America. Fragmented market in Europe.
• Laundry Great proportion of direct sales
although the trend is towards a growing share of
sales through dealers.
93 375 136
16% 8% 6%32%
7