Dow Chemical 2012 Annual Report Download - page 3
Download and view the complete annual report
Please find page 3 of the 2012 Dow Chemical annual report below. You can navigate through the pages in the report by either clicking on the pages listed below, or by using the keyword search tool below to find specific information within the annual report.-
 1
1 -
 2
2 -
 3
3 -
 4
4 -
 5
5 -
 6
6 -
 7
7 -
 8
8 -
 9
9 -
 10
10 -
 11
11 -
 12
12 -
 13
13 -
 14
14 -
15
-
16
-
17
-
18
-
19
-
20
-
21
-
22
-
23
-
24
-
25
-
26
-
27
-
28
-
29
-
30
-
31
-
32
-
33
-
34
-
35
-
36
-
37
-
38
-
39
-
40
-
41
-
42
-
43
-
44
-
45
-
46
-
47
-
48
-
49
-
50
-
51
-
52
-
53
-
54
-
55
-
56
-
57
-
58
-
59
-
60
-
61
-
62
-
63
-
64
-
65
-
66
-
67
-
68
-
69
-
70
-
71
-
72
-
73
-
74
-
75
-
76
-
77
-
78
-
79
-
80
-
81
-
82
-
83
-
84
-
85
-
86
-
87
-
88
-
89
-
90
-
91
-
92
-
93
-
94
-
95
-
96
-
97
-
98
-
99
-
100
-
101
-
102
-
103
-
104
-
105
-
106
-
107
-
108
-
109
-
110
-
111
-
112
-
113
-
114
-
115
-
116
-
117
-
118
-
119
-
120
-
121
-
122
-
123
-
124
-
125
-
126
-
127
-
128
-
129
-
130
-
131
-
132
-
133
-
134
-
135
-
136
-
137
-
138
-
139
-
140
-
141
-
142
-
143
-
144
-
145
-
146
-
147
-
148
-
149
-
150
-
151
-
152
-
153
-
154
-
155
-
156
-
157
-
158
-
159
-
160
-
161
-
162
-
163
-
164
-
165
-
166
-
167
-
168
-
169
-
170
-
171
-
172
-
173
-
174
-
175
-
176
-
177
-
178
-
179
-
180
-
181
-
182
-
183
-
184
-
185
-
186
-
187
-
188
-
189
-
190
-
191
-
192
-
193
-
194
-
195
-
196
 |
 |

2012 Annual Report 1
1 A reconciliation to the most directly comparable U.S. GAAP measure is provided on the Internet at www.dow.com/investor/earnings.
2 Net debt equals total debt (“Notes payable” plus “Long-term debt due within one year” plus “Long-term debt”) minus “Cash and cash equivalents” and
Certain statements in this report, other than purely historical information, including estimates, projections, statements relating to business plans, objectives,
and expected operating results, and the assumptions upon which those statements are based, are “forward-looking statements” within the meaning of the
“expect,” “anticipate,” “estimate,” “intend,” “strategy,” “future,” “opportunity,” “plan,” “may,” “should,” “will,” “would,” “will be,” “will continue,” “will likely result,”
and similar expressions. Forward-looking statements are based on current expectations and assumptions that are subject to risks and uncertainties which
any forward-looking statements whether because of new information, future events or otherwise, except as required by securities and other applicable laws.
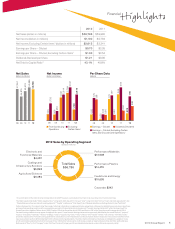
2012 Sales by Operating Segment
(dollars in millions)
2012 2011
Net Sales (dollars in millions) $56,786
Net Income (dollars in millions) $1,100
1 (dollars in millions) $2,615
$0.70
1 $1.90
$1.21
243.1%
Financial
ghghts
12
56,786
08 09 10
44,875
57,361
53,674
11
59,985
Earnings – Diluted Dividends Declared
12
1.21
0.70
1.90
0.60
1.6 8
08
0.62
09
1.7 9
0.32
10
0.63
0.60
1.7 2
1.97
11
0.90
2.05
2.54
12
1,100
Excluding
Certain Items1Earnings – Diluted, Excluding Certain
Items and Discontinued Operations1
From Continuing
Operations
08 09
626
1,730
10
566
955
2,321
11
2,784
2,614
3,341
2,615
Net Sales
(dollars in millions)
Net Income
(dollars in millions)
Per Share Data
(dollars)
Performance Materials
$13,608
Performance Plastics
$14,479
Feedstocks and Energy
$10,695
Corporate: $243
Electronic and
Functional Materials
$4,481
Coatings and
Infrastructure Solutions
$6,898
Agricultural Sciences
$6,382
Total Sales
$56,786