Dow Chemical 2012 Annual Report Download - page 15
Download and view the complete annual report
Please find page 15 of the 2012 Dow Chemical annual report below. You can navigate through the pages in the report by either clicking on the pages listed below, or by using the keyword search tool below to find specific information within the annual report.-
 1
1 -
2
-
3
-
4
-
 5
5 -
 6
6 -
 7
7 -
 8
8 -
 9
9 -
 10
10 -
 11
11 -
 12
12 -
 13
13 -
 14
14 -
 15
15 -
 16
16 -
 17
17 -
 18
18 -
 19
19 -
 20
20 -
 21
21 -
 22
22 -
 23
23 -
 24
24 -
 25
25 -
26
-
27
-
28
-
29
-
30
-
31
-
32
-
33
-
34
-
35
-
36
-
37
-
38
-
39
-
40
-
41
-
42
-
43
-
44
-
45
-
46
-
47
-
48
-
49
-
50
-
51
-
52
-
53
-
54
-
55
-
56
-
57
-
58
-
59
-
60
-
61
-
62
-
63
-
64
-
65
-
66
-
67
-
68
-
69
-
70
-
71
-
72
-
73
-
74
-
75
-
76
-
77
-
78
-
79
-
80
-
81
-
82
-
83
-
84
-
85
-
86
-
87
-
88
-
89
-
90
-
91
-
92
-
93
-
94
-
95
-
96
-
97
-
98
-
99
-
100
-
101
-
102
-
103
-
104
-
105
-
106
-
107
-
108
-
109
-
110
-
111
-
112
-
113
-
114
-
115
-
116
-
117
-
118
-
119
-
120
-
121
-
122
-
123
-
124
-
125
-
126
-
127
-
128
-
129
-
130
-
131
-
132
-
133
-
134
-
135
-
136
-
137
-
138
-
139
-
140
-
141
-
142
-
143
-
144
-
145
-
146
-
147
-
148
-
149
-
150
-
151
-
152
-
153
-
154
-
155
-
156
-
157
-
158
-
159
-
160
-
161
-
162
-
163
-
164
-
165
-
166
-
167
-
168
-
169
-
170
-
171
-
172
-
173
-
174
-
175
-
176
-
177
-
178
-
179
-
180
-
181
-
182
-
183
-
184
-
185
-
186
-
187
-
188
-
189
-
190
-
191
-
192
-
193
-
194
-
195
-
196
 |
 |

2012 Sales by
Key Product Lines
$6,382
Crop Protection
Seeds, Traits and Oils
Other
77%
21%
2%
Performance Plastics
Normalized Revenue Growth Target 1.4X GDP
EBITDA Margin Target 20–25%
2012 Adjusted EBITDA Margins121%
ROTC2 Value Driver Grow
Overview:
• Global leader in packaging materials and polyolefin
elastomers
• Leading global provider to the electrical and
telecommunications industry
• Portfolio geared toward faster-growing, higher-margin
sectors, with focus on emerging market opportunities
and leveraging feedstock advantage for a cost-competitive
manufacturing position
Agricultural Sciences
Normalized Revenue Growth Target 1.5X GDP
EBITDA Margin Target ~25%
2012 Adjusted EBITDA Margins115%
ROTC2 Value Driver Grow
Overview:
• Crop protection pipeline filled with high-value solutions
and proprietary formulations for the next 10 years
• Robust pipeline of plant biotechnology solutions
containing game-changing technology
• Strengthened channel access and technology
penetration, enabled by bolt-on seed acquisitions
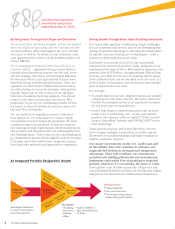
$8B
2012 Sales
by Business
$14,479
Dow Elastomers
Dow Hygiene and Medical
Dow Performance Packaging
Other
10%
5%
74%
2%
Dow Electrical and
Telecommunications
9%
13