Dow Chemical 2010 Annual Report Download - page 5
Download and view the complete annual report
Please find page 5 of the 2010 Dow Chemical annual report below. You can navigate through the pages in the report by either clicking on the pages listed below, or by using the keyword search tool below to find specific information within the annual report.-
 1
1 -
 2
2 -
 3
3 -
 4
4 -
 5
5 -
 6
6 -
 7
7 -
 8
8 -
 9
9 -
 10
10 -
 11
11 -
 12
12 -
 13
13 -
 14
14 -
 15
15 -
 16
16 -
17
-
18
-
19
-
20
-
21
-
22
-
23
-
24
-
25
-
26
-
27
-
28
-
29
-
30
-
31
-
32
-
33
-
34
-
35
-
36
-
37
-
38
-
39
-
40
-
41
-
42
-
43
-
44
-
45
-
46
-
47
-
48
-
49
-
50
-
51
-
52
-
53
-
54
-
55
-
56
-
57
-
58
-
59
-
60
-
61
-
62
-
63
-
64
-
65
-
66
-
67
-
68
-
69
-
70
-
71
-
72
-
73
-
74
-
75
-
76
-
77
-
78
-
79
-
80
-
81
-
82
-
83
-
84
-
85
-
86
-
87
-
88
-
89
-
90
-
91
-
92
-
93
-
94
-
95
-
96
-
97
-
98
-
99
-
100
-
101
-
102
-
103
-
104
-
105
-
106
-
107
-
108
-
109
-
110
-
111
-
112
-
113
-
114
-
115
-
116
-
117
-
118
-
119
-
120
-
121
-
122
-
123
-
124
-
125
-
126
-
127
-
128
-
129
-
130
-
131
-
132
-
133
-
134
-
135
-
136
-
137
-
138
-
139
-
140
-
141
-
142
-
143
-
144
-
145
-
146
-
147
-
148
-
149
-
150
-
151
-
152
-
153
-
154
-
155
-
156
-
157
-
158
-
159
-
160
-
161
-
162
-
163
-
164
-
165
-
166
-
167
-
168
-
169
-
170
-
171
-
172
-
173
-
174
-
175
-
176
-
177
-
178
-
179
-
180
-
181
-
182
-
183
-
184
-
185
-
186
-
187
-
188
-
189
-
190
-
191
-
192
-
193
-
194
-
195
-
196
-
197
-
198
-
199
-
200
-
201
-
202
-
203
-
204
-
205
-
206
-
207
-
208
-
209
-
210
-
211
-
212
-
213
-
214
-
215
-
216
-
217
-
218
-
219
-
220
-
221
-
222
-
223
-
224
-
225
-
226
-
227
-
228
-
229
-
230
-
231
-
232
-
233
-
234
-
235
-
236
-
237
-
238
-
239
-
240
-
241
-
242
-
243
-
244
-
245
-
246
-
247
-
248
-
249
-
250
-
251
-
252
-
253
-
254
-
255
-
256
-
257
-
258
-
259
-
260
-
261
-
262
-
263
-
264
-
265
-
266
-
267
-
268
-
269
-
270
-
271
-
272
-
273
-
274
-
275
-
276
-
277
-
278
 |
 |

2010 Annual Report 3
1 A reconciliation to the most directly comparable U.S. GAAP measure is provided on the Internet at www.dow.com/financial.
2 Net debt equals total debt (“Notes payable” plus “Long-term debt due within one year” plus “Long-term debt”) minus “Cash and cash equivalents.”
The forward-looking statements contained in this document involve risks and uncertainties that may affect the Company´s operations, markets, products, services, prices
and other factors as discussed more fully elsewhere and in filings with the U.S. Securities and Exchange Commission. These risks and uncertainties include, but are not
limited to, economic, competitive, legal, governmental and technological factors. Accordingly, there is no assurance that the Company´s expectations will be realized.
The Company assumes no obligation to provide revisions to any forward-looking statements should circumstances change, except as otherwise required by securities and
other applicable laws. References to “Dow“ or the “Company“ mean The Dow Chemical Company and its consolidated subsidiaries, unless otherwise expressly noted.
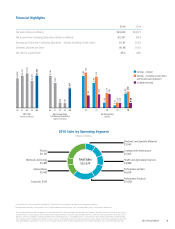
Net Sales
(dollars in millions)
06 07
49,009
08
53,375
09
57,361
10
44,875
53,674
06 07
3,796
08
2,962
09
626
10
566
2,321
Total Sales
$53,674
Plastics
$11,551
Chemicals and Energy
$3,485
Hydrocarbons
$5,442
Electronic and Specialty Materials
$5,040
Coatings and Infrastructure
$5,365
Health and Agricultural Sciences
$4,869
Performance Systems
$6,676
Performance Products
$10,903
Corporate: $343
Per Share Data
(dollars)
Net Income from
Continuing Operations
(dollars in millions)
Earnings – Excluding Certain Items
and Discontinued Operations1
Earnings – Diluted
Dividends Declared
1.50
0.60
1.68
06
3.82
07
4.23
2.99
08
3.74
1.635
0.62
09
1.79
0.32
10
0.63
0.60
1.72
1.97
Financial Highlights
2010 2009
Net Sales (dollars in millions) $53,674 $44,875
Net Income from Continuing Operations (dollars in millions) $2,321 $566
Earnings per Share from Continuing Operations – Diluted, Excluding Certain Items1$1.97 $0.63
Dividends Declared per Share $0.60 $0.60
Net Debt to Capital Ratio243% 48%
2010 Sales by Operating Segment
(dollars in millions)