Dow Chemical 2010 Annual Report Download - page 15
Download and view the complete annual report
Please find page 15 of the 2010 Dow Chemical annual report below. You can navigate through the pages in the report by either clicking on the pages listed below, or by using the keyword search tool below to find specific information within the annual report.-
 1
1 -
2
-
3
-
4
-
 5
5 -
 6
6 -
 7
7 -
 8
8 -
 9
9 -
 10
10 -
 11
11 -
 12
12 -
 13
13 -
 14
14 -
 15
15 -
 16
16 -
 17
17 -
 18
18 -
 19
19 -
 20
20 -
 21
21 -
 22
22 -
 23
23 -
 24
24 -
 25
25 -
26
-
27
-
28
-
29
-
30
-
31
-
32
-
33
-
34
-
35
-
36
-
37
-
38
-
39
-
40
-
41
-
42
-
43
-
44
-
45
-
46
-
47
-
48
-
49
-
50
-
51
-
52
-
53
-
54
-
55
-
56
-
57
-
58
-
59
-
60
-
61
-
62
-
63
-
64
-
65
-
66
-
67
-
68
-
69
-
70
-
71
-
72
-
73
-
74
-
75
-
76
-
77
-
78
-
79
-
80
-
81
-
82
-
83
-
84
-
85
-
86
-
87
-
88
-
89
-
90
-
91
-
92
-
93
-
94
-
95
-
96
-
97
-
98
-
99
-
100
-
101
-
102
-
103
-
104
-
105
-
106
-
107
-
108
-
109
-
110
-
111
-
112
-
113
-
114
-
115
-
116
-
117
-
118
-
119
-
120
-
121
-
122
-
123
-
124
-
125
-
126
-
127
-
128
-
129
-
130
-
131
-
132
-
133
-
134
-
135
-
136
-
137
-
138
-
139
-
140
-
141
-
142
-
143
-
144
-
145
-
146
-
147
-
148
-
149
-
150
-
151
-
152
-
153
-
154
-
155
-
156
-
157
-
158
-
159
-
160
-
161
-
162
-
163
-
164
-
165
-
166
-
167
-
168
-
169
-
170
-
171
-
172
-
173
-
174
-
175
-
176
-
177
-
178
-
179
-
180
-
181
-
182
-
183
-
184
-
185
-
186
-
187
-
188
-
189
-
190
-
191
-
192
-
193
-
194
-
195
-
196
-
197
-
198
-
199
-
200
-
201
-
202
-
203
-
204
-
205
-
206
-
207
-
208
-
209
-
210
-
211
-
212
-
213
-
214
-
215
-
216
-
217
-
218
-
219
-
220
-
221
-
222
-
223
-
224
-
225
-
226
-
227
-
228
-
229
-
230
-
231
-
232
-
233
-
234
-
235
-
236
-
237
-
238
-
239
-
240
-
241
-
242
-
243
-
244
-
245
-
246
-
247
-
248
-
249
-
250
-
251
-
252
-
253
-
254
-
255
-
256
-
257
-
258
-
259
-
260
-
261
-
262
-
263
-
264
-
265
-
266
-
267
-
268
-
269
-
270
-
271
-
272
-
273
-
274
-
275
-
276
-
277
-
278
 |
 |

2010 Annual Report 13
STRATEGY-IN-ACTION
Plastics: A Portfolio with Focus
We have executed changes to our Plastics segment that
have resulted in a tighter market focus and superior
financial returns.
We have streamlined our portfolio, moving away from high-
cost commodities toward higher-margin specialties. Our focus
is on high-value-added polymers, such as linear low density
polyethylene (LLDPE), which serve market segments such as
flexible food and specialty packaging, and health and
hygiene. These specialty market segments demand and
reward new technology innovation. And we are bringing
our solutions to regions that are growing rapidly – as
evidenced by a joint venture’s start-up of its Solution
Linear Low Density Polyethylene II train in Thailand.
Strengthening Our Feedstock Advantage
At the same time, we plan to boost our ethane
cracking capability in the United States by up to
30 percent over the next three years, capitalizing on
the region’s affordable and stable natural gas prices.
In addition, we are reviewing joint venture options for
building a natural gas liquids fractionator. Both actions
will further strengthen the competitive advantage of
our higher-margin specialty plastics, Performance and
Advanced Materials segments.
We continue to bolster our integration strength in
cost-effective ways. In December, Dow finalized a joint
venture agreement with Mitsui to construct and operate
a new chlor-alkali facility at Dow’s Freeport, Texas, site.
The 50:50 joint venture will result in a world-scale chlor-
alkali plant that will supply critical building blocks to Dow’s
downstream businesses – at lower cost and with less capital.
Relationships: Partnering for Growth
Overall, our joint ventures delivered $1.1 billion in EBITDA to
Dow in 2010, representing a 54 percent increase from 2009,
excluding certain items.1 An integral part of our business
model, our joint venture activities have risen markedly in
recent years. For example:
•DowCorning’sequityearningshavegrownbynearly20percent
a year since 2004. This growth is expected to continue as new
silicone capacity comes online in China and as Dow Corning
increases its ability to support key industries such as electronics
and solar through its Hemlock Semiconductor joint venture.
•EQUATEPetrochemicalCompany,whichproducespolyethylene
and ethylene glycol for customers throughout Europe, Middle
East and Asia, is benefiting from recent expansions that nearly
doubled production capacity.
•DowKokambrokegroundonitsMidlandBatteryParkfacility
in June 2010. The plant, which will manufacture 600,000
watt-hours of advanced lithium ion batteries for the growing
plug-in hybrid and electrical vehicle business, is on target for
start-up in first quarter 2012. Already revenue positive, the joint
venture also began commercial production at a new facility
in France, to produce battery systems to power 15,000 fully
electric vehicles annually.
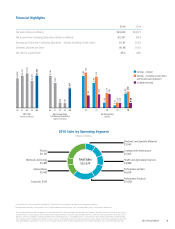
2010 Dow Proportionate Share of All Principal JV Sales* by Geography
North America
24%
Europe, Middle East
and Africa
28%
Asia Pacific
41%
Latin America
7%
Equity Earnings from Nonconsolidated Affiliates
($ in millions)
05
$964
06
$959
07
$1,122
08
$787
09
$630
10
$1,112
+
1 See supplemental information on www.dow.com/financial for a description of these items.
* Adjusted Net Sales is equal to Net Sales for these joint ventures less sales to Dow and/or
to other Dow joint ventures.