Dish Network 2013 Annual Report Download - page 85
Download and view the complete annual report
Please find page 85 of the 2013 Dish Network annual report below. You can navigate through the pages in the report by either clicking on the pages listed below, or by using the keyword search tool below to find specific information within the annual report.-
 1
1 -
2
-
3
-
4
-
5
-
6
-
7
-
8
-
9
-
10
-
11
-
12
-
13
-
14
-
15
-
16
-
17
-
18
-
19
-
20
-
21
-
22
-
23
-
24
-
25
-
26
-
27
-
28
-
29
-
30
-
31
-
32
-
33
-
34
-
35
-
36
-
37
-
38
-
39
-
40
-
41
-
42
-
43
-
44
-
45
-
46
-
47
-
48
-
49
-
50
-
51
-
52
-
53
-
54
-
55
-
56
-
57
-
58
-
59
-
60
-
61
-
62
-
63
-
64
-
65
-
66
-
67
-
68
-
69
-
70
-
71
-
72
-
73
-
74
-
 75
75 -
 76
76 -
 77
77 -
 78
78 -
 79
79 -
 80
80 -
 81
81 -
 82
82 -
 83
83 -
 84
84 -
 85
85 -
 86
86 -
 87
87 -
 88
88 -
 89
89 -
 90
90 -
 91
91 -
 92
92 -
 93
93 -
 94
94 -
 95
95 -
96
-
97
-
98
-
99
-
100
-
101
-
102
-
103
-
104
-
105
-
106
-
107
-
108
-
109
-
110
-
111
-
112
-
113
-
114
-
115
-
116
-
117
-
118
-
119
-
120
-
121
-
122
-
123
-
124
-
125
-
126
-
127
-
128
-
129
-
130
-
131
-
132
-
133
-
134
-
135
-
136
-
137
-
138
-
139
-
140
-
141
-
142
-
143
-
144
-
145
-
146
-
147
-
148
-
149
-
150
-
151
-
152
-
153
-
154
-
155
-
156
-
157
-
158
-
159
-
160
-
161
-
162
-
163
-
164
-
165
-
166
-
167
-
168
-
169
-
170
-
171
-
172
-
173
-
174
-
175
-
176
-
177
-
178
-
179
-
180
-
181
-
182
-
183
-
184
-
185
-
186
-
187
-
188
-
189
-
190
-
191
-
192
 |
 |

Item 7. MANAGEMENT’S DISCUSSION AND ANALYSIS OF FINANCIAL CONDITION AND
RESULTS OF OPERATIONS - Continued
75
75
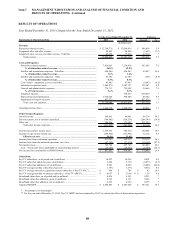
Subscriber acquisition costs. “Subscriber acquisition costs” totaled $1.687 billion for the year ended December 31,
2012, an increase of $182 million or 12.1% compared to the same period in 2011. This increase was primarily
attributable to the increase in gross new subscriber activations and SAC described below. Included in “Subscriber
acquisition costs” was $46 million and $1 million of expenses related to our broadband services for the years ended
December 31, 2012 and 2011, respectively.
Pay-TV SAC. Pay-TV SAC was $784 during the year ended December 31, 2012 compared to $770 during the same
period in 2011, an increase of $14 or 1.8%. This increase was primarily attributable to increased advertising associated
with our Hopper set-top box.
During the years ended December 31, 2012 and 2011, the amount of equipment capitalized under our lease program
for new Pay-TV subscribers totaled $506 million and $480 million, respectively. This increase in capital expenditures
under our lease program for new Pay-TV subscribers resulted primarily from an increase in gross new Pay-TV
subscribers.
Our Pay-TV SAC calculation did not reflect any benefit from payments we received in connection with equipment
not returned to us from disconnecting lease subscribers and returned equipment that was made available for sale or
used in our existing customer lease program rather than being redeployed through our new customer lease program.
During the years ended December 31, 2012 and 2011, these amounts totaled $140 million and $96 million,
respectively.
General and administrative expenses. “General and administrative expenses” totaled $722 million during the year
ended December 31, 2012, an $85 million or 13.3% increase compared to the same period in 2011. This increase was
primarily due to increased costs related to our wireless and broadband operations during 2012 and increased pay-TV
expenses associated with personnel, infrastructure and non-cash stock-based compensation expense.
Litigation expense. “Litigation expense” related to legal settlements, judgments or accruals associated with certain
significant litigation totaled $730 million during the year ended December 31, 2012 related to the Voom Settlement
Agreement. During the year ended December 31, 2011, “Litigation expense” totaled a negative $317 million.
During the year ended December 31, 2011, we reversed $341 million related to the April 29, 2011 settlement
agreement with TiVo, which was previously recorded as an expense. See Note 20 in the Notes to our Consolidated
Financial Statements in Item 15 of this Annual Report on Form 10-K for further information.
Depreciation and amortization. “Depreciation and amortization” expense totaled $964 million during the year ended
December 31, 2012, a $52 million or 5.7% increase compared to the same period in 2011. This change in
“Depreciation and amortization” expense was primarily due to $68 million of depreciation expense related to the 148
degree orbital location in 2012 and an increase in depreciation expense associated with additional assets which were
placed in service to support DISH Network, partially offset by a decrease in depreciation expense on equipment
leased to subscribers. See Note 8 in the Notes to the Consolidated Financial Statements in Item 15 of this Annual
Report on Form 10-K for further information.
Interest income. “Interest income” totaled $99 million during the year ended December 31, 2012, an increase of $65
million compared to the same period in 2011. This increase principally resulted from higher percentage returns earned
on our cash and marketable investment securities and higher average cash and marketable investment securities
balances during the year ended December 31, 2012.
Interest expense, net of amounts capitalized. “Interest expense, net of amounts capitalized” totaled $536 million
during the year ended December 31, 2012, a decrease of $22 million or 3.9% compared to the same period in 2011.
This change primarily resulted from capitalized interest of $106 million related to our wireless spectrum, partially
offset by the net interest expense associated with the issuances and redemption of our senior notes during 2012 and
2011.