Dish Network 2013 Annual Report Download - page 157
Download and view the complete annual report
Please find page 157 of the 2013 Dish Network annual report below. You can navigate through the pages in the report by either clicking on the pages listed below, or by using the keyword search tool below to find specific information within the annual report.-
 1
1 -
2
-
3
-
4
-
5
-
6
-
7
-
8
-
9
-
10
-
11
-
12
-
13
-
14
-
15
-
16
-
17
-
18
-
19
-
20
-
21
-
22
-
23
-
24
-
25
-
26
-
27
-
28
-
29
-
30
-
31
-
32
-
33
-
34
-
35
-
36
-
37
-
38
-
39
-
40
-
41
-
42
-
43
-
44
-
45
-
46
-
47
-
48
-
49
-
50
-
51
-
52
-
53
-
54
-
55
-
56
-
57
-
58
-
59
-
60
-
61
-
62
-
63
-
64
-
65
-
66
-
67
-
68
-
69
-
70
-
71
-
72
-
73
-
74
-
75
-
76
-
77
-
78
-
79
-
80
-
81
-
82
-
83
-
84
-
85
-
86
-
87
-
88
-
89
-
90
-
91
-
92
-
93
-
94
-
95
-
96
-
97
-
98
-
99
-
100
-
101
-
102
-
103
-
104
-
105
-
106
-
107
-
108
-
109
-
110
-
111
-
112
-
113
-
114
-
115
-
116
-
117
-
118
-
119
-
120
-
121
-
122
-
123
-
124
-
125
-
126
-
127
-
128
-
129
-
130
-
131
-
132
-
133
-
134
-
135
-
136
-
137
-
138
-
139
-
140
-
141
-
142
-
143
-
144
-
145
-
146
-
 147
147 -
 148
148 -
 149
149 -
 150
150 -
 151
151 -
 152
152 -
 153
153 -
 154
154 -
 155
155 -
 156
156 -
 157
157 -
 158
158 -
 159
159 -
 160
160 -
 161
161 -
 162
162 -
 163
163 -
 164
164 -
 165
165 -
 166
166 -
 167
167 -
168
-
169
-
170
-
171
-
172
-
173
-
174
-
175
-
176
-
177
-
178
-
179
-
180
-
181
-
182
-
183
-
184
-
185
-
186
-
187
-
188
-
189
-
190
-
191
-
192
 |
 |

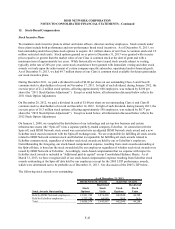
DISH NETWORK CORPORATION
NOTES TO CONSOLIDATED FINANCIAL STATEMENTS - Continued
F-47
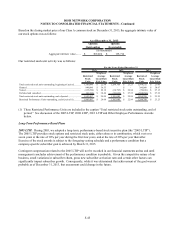
Given the competitive nature of our business, small variations in subscriber churn, gross new subscriber activation
rates and certain other factors can significantly impact subscriber growth. Consequently, while it was determined that
achievement of certain other company-specific subscriber, operational and/or financial goals was not probable as of
December 31, 2013, that assessment could change in the future.
The non-cash, stock-based compensation expense associated with these awards was as follows:
Non-Cash, Stock-Based Compensation Expense Recognized 2013 2012 2011
2008 LTIP......................................................................................... 2,889$ 9,246$ 18,944$
2013 LTIP......................................................................................... 8,137 - -
Other employee performance awards................................................ 4,045 7,471 218
Non-cash, stock-based compensation expense recognized for
performance based awards from continuing operations.................. 15,071 16,717 19,162
Non-cash, stock-based compensation expense recognized for
performance based awards from discontinued operations.............. 182 566 78
Total non-cash, s tock-based compensation ex pense
recognized for performance based awards...................................... 15,253$ 17,283$ 19,240$
For the Years Ended December 31,
(In thousands)
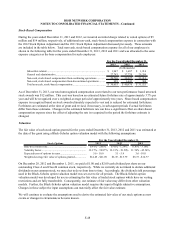
Estimated Remaining Non-Cash, Stock-Based Compensation Expense 2013 LTIP
Other
Emp loyee
Performance
Awards
Expense estimated to be recognized during 2014.......................................... 5,460$ 432$
Estimated contingent expense subsequent to 2014........................................ 52,311 38,817
Total estimated remaining expense over the term of the plan........................ 57,771$ 39,249$
(In thousands)
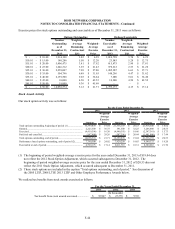
Of the 14.1 million stock options and 1.9 million restricted stock units outstanding under our stock incentive plans
as of December 31, 2013, the following awards were outstanding pursuant to our performance-based stock incentive
plans:
Performance Based Stock Options
Number of
Awards
Weighted-
Average
Grant Price
2005 LTIP................................................................ 3,200,500 20.33$
2013 LTIP................................................................ 1,920,000 36.53$
Other employee performance awards....................... 2,670,000 19.46$
Total......................................................................... 7,790,500 24.02$
Restricted Performance Units
2005 LTIP................................................................ 288,497
2013 LTIP................................................................ 960,000
Other employee performance awards....................... 695,000
Total......................................................................... 1,943,497
As of December 31, 2013